|
Color Variable Configuration for Numeric Columns
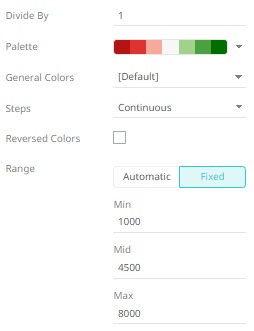
When you add a numeric column to a Color variable, the configuration pane displays a set of options similar to the pane for the Size variable. This allows you to define the data display format and aggregation method:
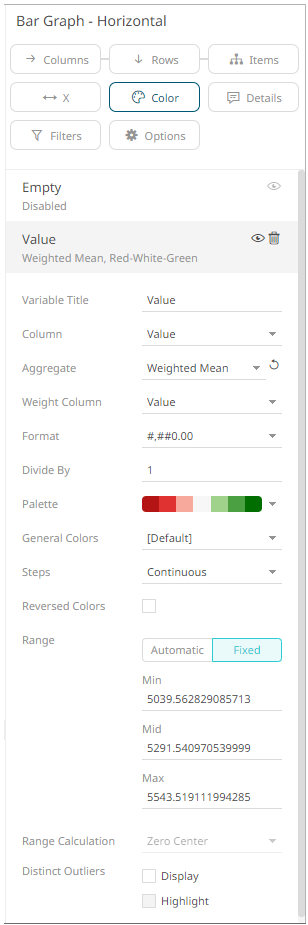
Other configuration options for numeric color variables include:
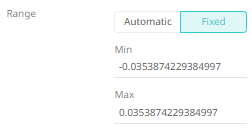
q Range
The Min and Max text boxes are populated default values from the data set.
q Automatic Limits/Range Calculation
Disables the Range option and supports either:
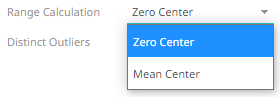
· Zero Center range calculation
· Mean Center range calculation
q Divide By
Enter
the Divide By value then click  to divide fixed and automatic
ranges.
to divide fixed and automatic
ranges.
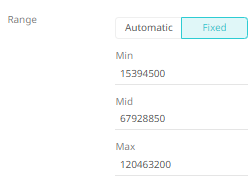
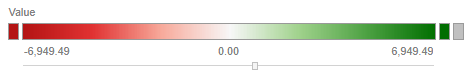
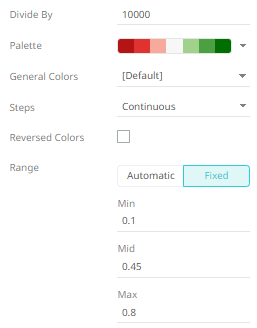
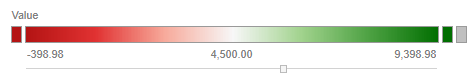
For example, for this range:
When the Divide By is 10000, then the range values will be:
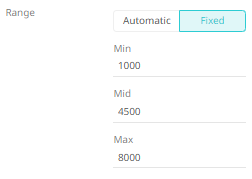
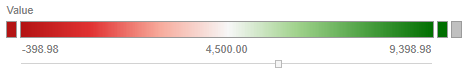
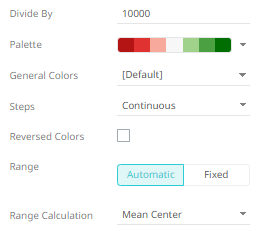
Another example for the Automatic Range:
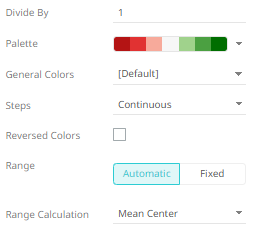
When the Divide by is 1000000, then the automatic range values will be:
q Palette
The text, sequential, and diverging color palettes that is used in numeric color variables in visualizations
q General Colors
The general colors to be used for visualizations.
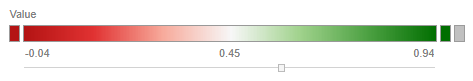
q Continuous/Stepped Colors
The color palette can either be a continuous color gradient or a stepped color gradient.
You can define this setting using the appropriate radio button.
Continuous Colors produces this effect:

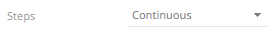
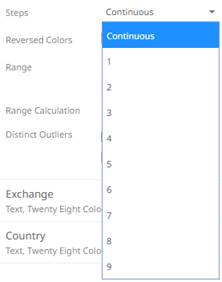
Stepped Colors produces this effect:

Select the number of steps in the gradient in the Steps list box.
q Reversed Colors
You can reverse the color palette for cases where a high number indicates poor performance. For example, if your data shows high risk as a high number, it may be more useful to display high risk using Red rather than Blue.
|
Standard Palette |
|
|
|
Reversed Palette |
|
|


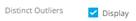
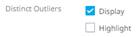
q Distinct Outlier Colors
When outliers are of particular interest, you can highlight outliers using the Distinct Outlier Colors function.
|
Without Outlier Colors |
|
|
|
With Outlier Colors |
|
|


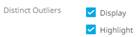
q Highlighted Outlier Colors
Where only the outliers are important, the central color range is grayed and only the Distinct Outlier Colors are highlighted in the visualization.
|
With Outlier Colors |
|
|
|
With Highlighted Outlier Colors |
|
|
Panopticon supports two types of Numeric Color Palettes: Sequential and Diverging.
Sequential Palettes use a two-color gradient between a minimum and a maximum value. Numeric column containing only positive values default to a Sequential Palette using the White-Blue color palette.
In this case the range Mid point is disabled, and the Min and Max points are populated with defaults from the data set.
Diverging Palettes use a three-color gradient between a minimum, middle and a maximum value. Numeric columns containing both positive and negative values default to the Diverging Palette with the Red White Blue color palette selected.
Diverging Palettes use the Range Midpoint. The Min, Mid and Max points are populated with defaults from the data set.