


|
BoxPlot Variable Configuration
The BoxPlot variable is available in the Box Plot visualization.
Steps:
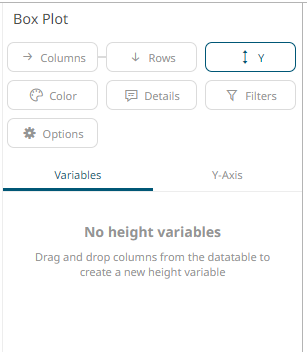
1. On the Visualization Settings pane, click the Y (BoxPlot) variable.
Initially, the variable has no value.
2. To associate other columns from the data table, drag and drop them to the BoxPlot variable drop area. Select one to display the corresponding configuration pane.
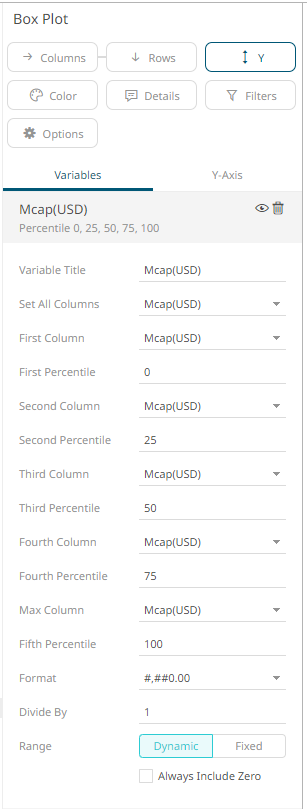
3. Enter the label of the BoxPlot variable in the Variable Title field.
You can parameterize the variable title to support dynamic schema in the dashboards
4. The associated column is displayed in Set All Columns and all of the five sub variables are automatically populated with this column: First Column, Second Column, Third Column, Fourth Column, and Fifth Column.
This allows for automatically drawing a boxplot based on a single column. The variable also allows for changing each column of each sub variables, which can be used in case the values are precalculated.
5. The percentile values of the member variables are configurable. Each percentile can be set to any value between 0 to 100. The values default to 0 (Min), 25 (First Quartile), 50 (Median), 75 (Third Quartile), 100 (Max), respectively.
The percentile aggregate is calculated with inclusive median.
|
NOTE |
In case the boxplot is compared to the boxplot in MS Excel, ensure it is configured to use the inclusive median.
|
6. The Format field lets you specify the format that numbers will be displayed in. Panopticon uses the same formatting rules as Excel.
7. Select the Divide By value to divide a number:
· 1
· 1000 (by a thousand)
· 10000
· 1000000 (by a million)
· 1000000000 (by a billion)
8. The visible range for the BoxPlot variable can either be calculated dynamically (the default, enabled Dynamic).
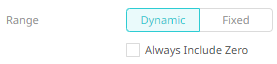
Check the Always Include Zero box to let the axis scale start at zero, and grow to any number that may show up in the data.
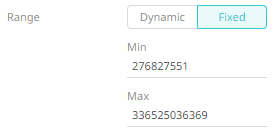
Or set between predefined limits by clicking Fixed. This reveals the Min and Max text boxes and populates them with default values taken from the data set.
9. Click the Save  icon on the toolbar.
When
saved, the  notification is displayed.