BasicFEA

Contour panel

Contour panel

Previous topic Next topic Expand/collapse all hidden text  

Contour panel

Previous topic Next topic JavaScript is required for expanding text JavaScript is required for the print function  

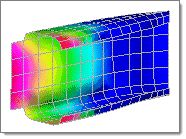
Use the Contour panel to create contour and assigned plots of your model. Use this function to see your analysis results graphically, in either a contour or assigned plot mode.    

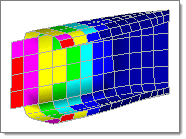
A contour plot allows you to see results represented as bands of color, based on the values returned from an analysis code.  An assigned plot lets you see the values of each element by coloring the entire element, which provides an alternate way to view your analysis results. When you create a plot, default values are assigned to the colors in the legend.  The legend subpanel allows you to redefine the colors in the legend of the plot.

In BasicFEA, values are located at either the nodes or the centroids of the elements.  If you have results based on values at the nodes, the contour plot is created without averaging.  An assigned plot can be created from nodal results, but the nodes are first averaged to create a value at the centroid of the element.

If you have values at the centroid of the elements, the assigned plot is created without averaging.  A contour plot can be created if your results are based on values at the centroid, but the values must first be averaged.  First, the nodes of the element are given the same value as the centroid of the element.  Then the values at each node are added to the corresponding nodes of the neighboring elements.  The sum of those nodes is then divided by the number of elements that contributed to the value at that node.  The resulting value is assigned to the node at that point.

Both assigned and contour plots are available to provide a no-averaging option, whether your results are based on values at the nodes or at the centroids.
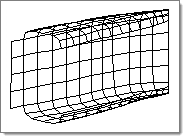
Note:You must load an analysis results file (click fileOpenResults-24 on the toolbar) before you can create a contour.


Examples:


Contour Plot

HM_Panels_bmp00069

Model

HM_Panels_bmp00070

Contour plot of model.
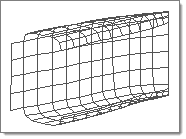
Assigned Plot

HM_Panels_bmp00071

Original

HM_Panels_bmp00072

Assigned plot of model

Subpanels and Inputs


The Contour panel contains the following subpanels and command buttons:

expand-green-10Params

Panel Inputs

Input

Action

simulation

Enter or select the name of the simulation that should be used to calculate the contours.

data type

Enter or select the name of the data type that should be used to calculate the contours.

title

Enter a title for the plot.

magnitude / x, y, z comp

A component of displacement can be used by selecting x comp, y comp, or z comp from the pop-up menu.

undeformed / model units / scale factor

Mode of the assigned plot.

If you select model units, specify the number of model units to use in calculations.
If you select scale factor, enter the scale factor.

mult =

Values in the results file may be multiplied by a scale factor other than 1.0.  To change the scale factor, click mult = and enter the new scale factor; the values in the results file are changed to reflect this factor.

min / max titles

Display the titles to the entities with the least and greatest results values.

For contour plots, the titles are attached to nodes.

info titles

This option will be used when displaying the results.

In this case, activating the checkbox causes an informational title to be displayed in the graphics area.


expand-green-10Legend

Panel Inputs

Input

Action

simulation

Enter or select the name of the simulation that should be used to calculate the contours.

data type

Enter or select the name of the data type that should be used to calculate the contours.

title

Enter a title for the plot.

find maximum / maximum

The value to be assigned to the highest color in the plot.

find minimum / minimum

The value to be assigned to the lowest color in the plot.


expand-green-10Cutting

Once a plane has been activated, it can be moved through the model by picking the plane in the graphics area and dragging the mouse along the normal of the plane.

Planes can be trimmed and colored.

Planes can be single planes or double planes.  If double is selected the menu item t = represents the thickness of the plane or the offset from the base cutting plane.


Panel Inputs

Input

Action

simulation

Enter or select the name of the simulation that should be used to calculate the contours.

data type

Enter or select the name of the data type that should be used to calculate the contours.

title

Enter a title for the plot.

xy, yz, xz plane

Select the desired plane(s) to use as a cutting surface.

trim planes

When active, the model is masked so that only the parts beyond the cutting plane display.  When inactive, only the plane displays.

reset planes

Resets the cutting planes to default values.

clip boundary elements

When active, the model is cut flat long the planar surface.  When inactive, complete elements are drawn, often resulting in a bumpy surface.


expand-green-10Isosurface

Isosurfaces may be displayed based on the values contained within the legend or based on a single value.

If a single value isosurface is displayed, you can modify the value of the isosurface.  To modify the value:

1.Move the mouse into the legend and select the pointer that appears after the color boxes.
2.Hold the mouse button down and move the mouse to the desired location.


You may also set the value by using the menu item, iso surface =, or increment by using increment = and the add and sub menu items.

The color of the displayed isosurface can be the legend color or a constant user- selected value.  See the menu item, legend color, while displaying a value-based isosurface.

While a value-based isosurface is displayed, you can choose to display the faces in the model that are above the isosurface value by selecting include faces above.

While a value-based isosurface is displayed, you can choose to display the faces in the model that are above the isosurface value by selecting transparent below.


Panel Inputs

Input

Action

simulation

Enter or select the name of the simulation that should be used to calculate the contours.

data type

Enter or select the name of the data type that should be used to calculate the contours.

title

Enter a title for the plot.

value based / legend based

Either type in a contour value for elements/nodes that you wish to display, or use legend-based to pick the desired value with the mouse via the onscreen legend.

increment

This amount will be added or subtracted from the selected values (which determine the displayed elements/nodes) when the add or sub buttons are clicked.

include faces above

When active, elements/nodes with values equal to or above the selected value display.

include faces below

When active, elements/nodes with values equal to or below the selected value display.


expand-green-10Command Buttons

The following action buttons appear throughout the subpanels:

Button

Action

contour

Create the contour.

prev / next

The prev or next which is on the same line as the simulation changes only the simulation.  The prev or next which is on the same line as the data type changes only the data type.

If the simulation or data type is at the first position as found in the results file, selecting prev results in the simulation or data type being assigned to the last position in the file.

If the simulation or data type is at the last position as found in the results file, selecting next results in the simulation or data type being assigned to the first position in the file.

assign

An assigned plot is element-based, creating the contour with lower resolution because each element has exactly one value.  The default smooth contour averages element values at each node.

add

When a contour legend value is selected, this increases the value that it represents by the increment.

sub

When a contour legend value is selected, this decreases the value that it represents by the increment.

return

Exits the panel.


See Also:

Alphabetical List of Panels