A polar graph allows you to plot data that has at least one
angular axis. You can either plot a full polar graph or only display a sector of the polar
graph.
On the Home tab, in the
Create new display group, click the Polar
icon.
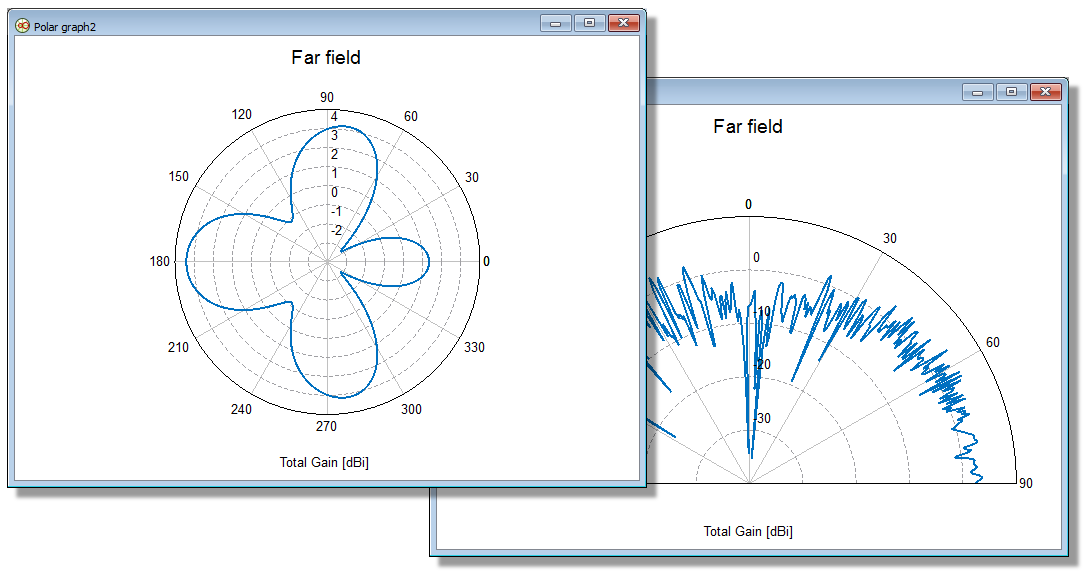
Figure 1. Example of a full polar graph and sector of a
polar graph.
 Polar
icon.
Polar
icon.