Local Settings Dialog
The Local Settings dialog covers all settings and parameters of the current CoMan project.
The Local Settings dialog specifically covers all settings and parameters of the current project which are not directly related to the configuration parameters of the wireless system. The Local Settings dialog can be accessed by selecting or by pressing the corresponding button on the Edit toolbar.
General Tab
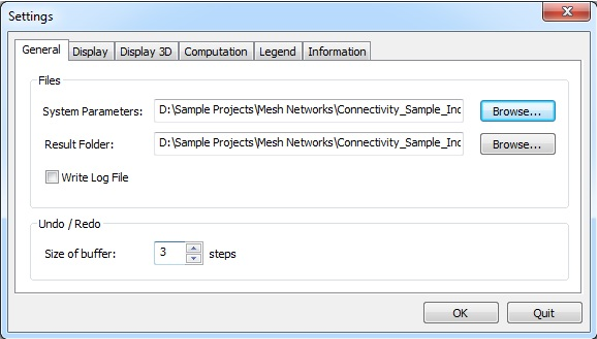
Figure 1. The Settings dialog, General tab.
- Files
- File paths and names of system parameter file, result folder and log file.
- Undo / Redo
- Size of the undo / redo buffer, thus the number of steps that can be undone or redone, respectively.
Display Tab
The Display tab covers general settings related to the 2D View and 3D View displays.
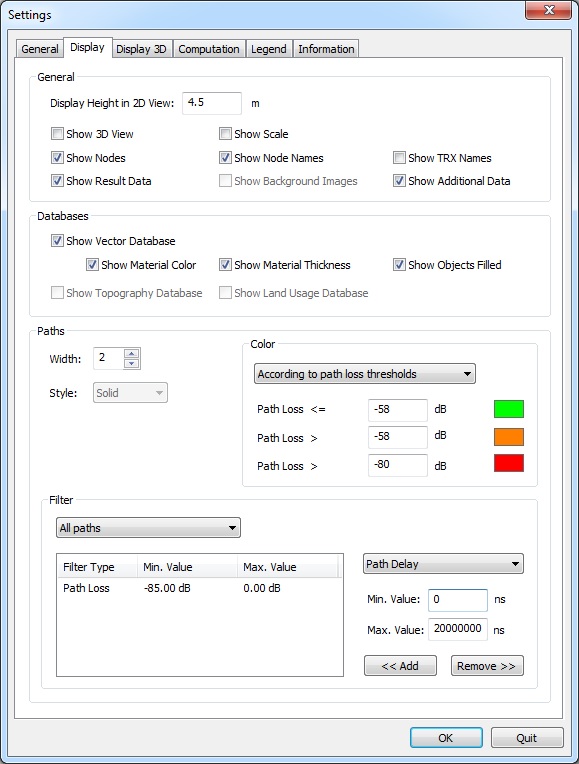
Figure 2. The Settings dialog, Display tab.
- General
-
- Display height in 2D View
- This value is the horizontal cut plane height. It is shown in the status bar and can be modified by pressing Shift while scrolling the mouse wheel in the 2D View. Further objects to be drawn in the 2D View and (partly) in the 3D View can also be selected here.
- Databases
- Databases to be visualized in the Project View can be selected here. The objects of vector databases can be displayed using their individual material colors, material thickness, filled or in wire frame mode.
- Paths
- The width and drawing style of paths can be changed by adjusting the corresponding fields. Line styles other than “Solid” can be selected only for path widths of one. If a path width larger than one is selected, the style automatically changes to “Solid”.
- Color
- There are five different modes available for the colorization of paths showing
the information flow between the nodes of the simulated network.
- Unique Color: A single user defined color will be
used to draw all paths. This color can be changed by clicking on the colored
rectangle on the right-hand side.Note: In case multiple nodes are selected for displaying connectivity paths, this mode will be selected automatically.
- According to Path Type: Pre-defined colors that indicate the type (direct neighbor, gateway, optimum) of the paths are used.
- According to Path Loss Thresholds: This option offers the possibility to define arbitrary thresholds and corresponding path colors for different path losses. The colors for the defined thresholds can be changed by clicking on the colored rectangles.
- According to Path Delay Thresholds: This option offers the possibility to define arbitrary thresholds and corresponding path colors for different path delays. The colors for the defined thresholds can be changed by clicking on the colored rectangles.
- According to Received Power Thresholds: This option
offers the possibility to define arbitrary thresholds and corresponding path
colors for different received power values. The colors for the defined
thresholds can be changed by clicking on the colored rectangles.Note: As there are two nodes corresponding to a path segment, the received power values of both nodes are evaluated. The path segment is colored according to the defined threshold color of the lowest received power.
- Unique Color: A single user defined color will be
used to draw all paths. This color can be changed by clicking on the colored
rectangle on the right-hand side.
- Filter
- Path types that will be displayed can be selected using the first drop-down list of this section.Note: Choose Online visualization before running a Connectivity Prediction in order to visualize the determination of the optimum paths.
Path data can be further filtered using a minimum and a maximum value of a specific key parameter of the path. Currently filters for path delay, path loss, probability of failure and probability of stability can be applied. Active path filters are listed in the list box on the left-hand side. If one or multiple path filters are active, the paths will be displayed only if the corresponding path parameter is within the defined minimum and maximum value of the filter.
Display 3D Tab
Settings for the 3D View are set on this tab.
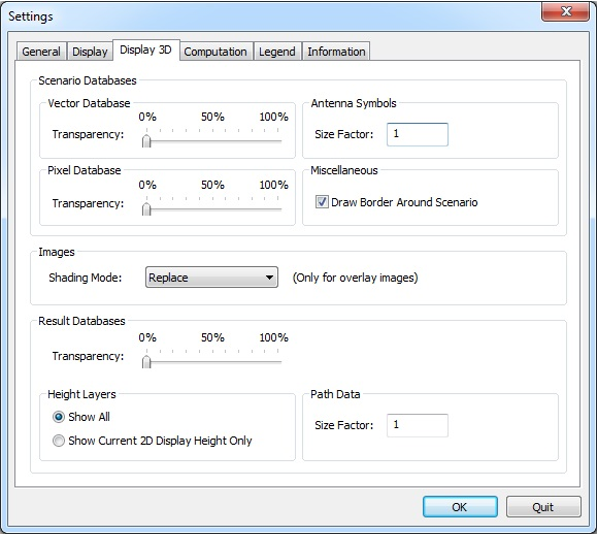
Figure 3. The Settings dialog, Display 3D tab.
- Scenario Databases
-
- Vector Database
- Set the transparency level for objects contained in the vector databases. A value of 0% results in opaque objects while a value of 100% results in completely transparent objects.
- Pixel Database
- Set the transparency level for pixels contained in pixel databases (topography or clutter/morpho databases). A value of 0% results in opaque pixels while a value of 100% results in completely transparent pixels.
- Antenna Symbols
- Set the Size Factor for drawing antenna symbols on the 3D View.
- Miscellaneous:
- Enable or disable drawing of optional border around the scenario database.
- Images
- In case images are specified to be an overlay for topography or result databases, the shading mode can be defined here. If Replace is chosen, the database will get the corresponding color of the image pixels. If Add is selected, the colors of the database and the image pixels will be added.
- Result Databases
- Set the transparency level for pixels contained in result databases. A value of 0% results in opaque pixels while a value of 100% results in completely transparent pixels.
- Height Layers
- In case of multiple prediction heights, either all predicted height layers or
only the one currently shown on the 2D View can be displayed.Note: The current display height for the 2D View can be specified on the Display tab.
- Path Data
- Set the Size Factor for drawing information flow paths on
the 3D View.Note: The colorization of the paths can specified for 2D View and 3D View on the Display tab.
Computation Tab
All parameters related to the computation engine can be found on this tab.
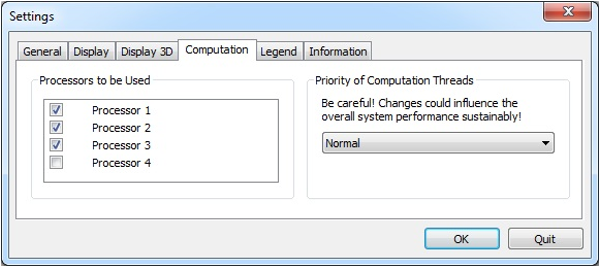
Figure 4. The Settings dialog, Computation tab.
- Processors to be Used
- Check processors that can be used by the computation engine to compute the selected computation task. If multiple processors are enabled the engine will compute multiple nodes in parallel, which speeds up the computation time.
- Priority of Computation Threads
- Priority level which is used to run computation tasks.Note: Changes could influence the overall system performance sustainable! Therefore it is not recommended to change this value.
Legend Tab
Settings of the Legend View which are automatically assigned for each type of result or database, such as color palette or the value range can be adjusted on the Legend tab.
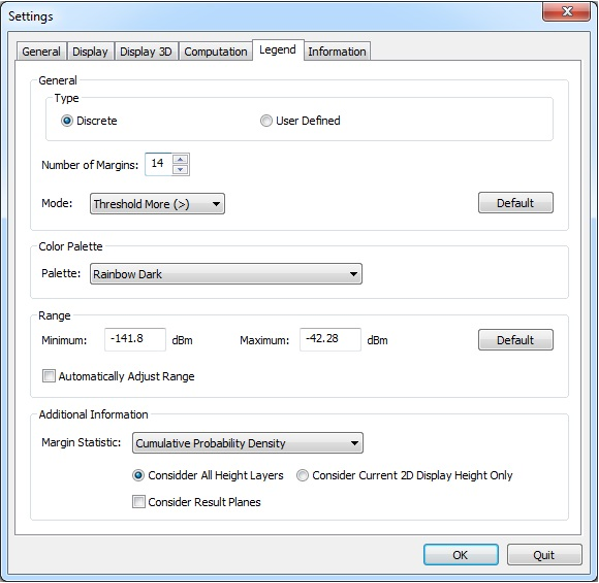
Figure 5. The Settings dialog, Legend tab.
- Type
- Discrete legends have a fixed linear scale with range between the specified
minimum and maximum value (see the Range section) as well as a predefined color
palette, which can be chosen in the Color Palette group.
User Defined Legends can be customized individually by the user. Legends in
CoMan can, depending on the type of the currently
displayed database or result, have up to 14 discrete color margins. The mode of
the legend selects the sign of the defined scale margins. Possible values are
Threshold More, Threshold equal,
or Threshold less.
Clicking the Default button will reset the values to the defaults for the currently active database or result
- Color Palette
- Pre-defined color palettes for the scale.
- Range
- Minimum and maximum values defining the range, which is displayed in the Legend
View.
Clicking the Default button will reset the values to the overall minimum and maximum value contained in the currently active environment or result database.
If the option Automatically adjust range is enabled, the value range will be reset to the overall minimum and maximum value contained in the currently active environment or result database each time a result or database of this type is loaded. This guarantees that the whole range of values is always covered by the legend. In case this option is not active, the specified range of values will not change for this type of result or database, even if a new result or database is loaded. That makes it possible to easily compare results using the same scale range.
- Additional Information
- Margin Statistic:
Information Tab
Settings corresponding to the Information View can be specified on the Information tab of the Local Settings dialog.
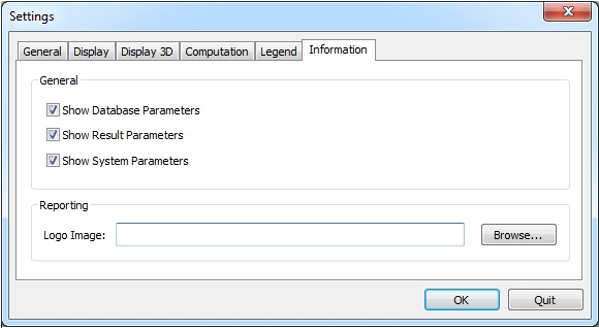
Figure 6. The Settings dialog, Information tab.
- General
- Enable or disable the display of database, result and system parameters in the Information View.
- Reporting
- Logo Image: