Viewing the Prediction Results
Display the power results using the dominant path model.
-
View the power using the dominant path model in the urban
environment.
-
In the tree, expand
 Results: Propagation to view site 1.
-
In the tree, expand
 Site 1 to view the three antennas.
-
In the tree, expand
 Site 1 Antenna 3 to view the Field
Strength and Power entries.
Site 1 Antenna 3 to view the Field
Strength and Power entries.
-
In the tree, click
 Power to view the results.
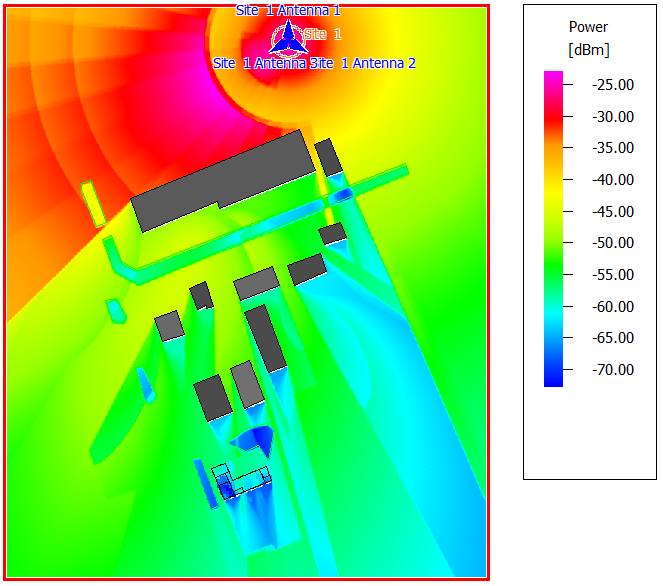
Figure 1. Power calculated using the dominant path model (DPM).
-
In the tree, expand
-
View the power for the indoor database.
- Zoom in on the indoor database.
- Right-click on the legend and from the right-click context menu, click .
- In the Max field, enter a value of -50 dBm.
- In the Min field. enter a value of -90 dBm.
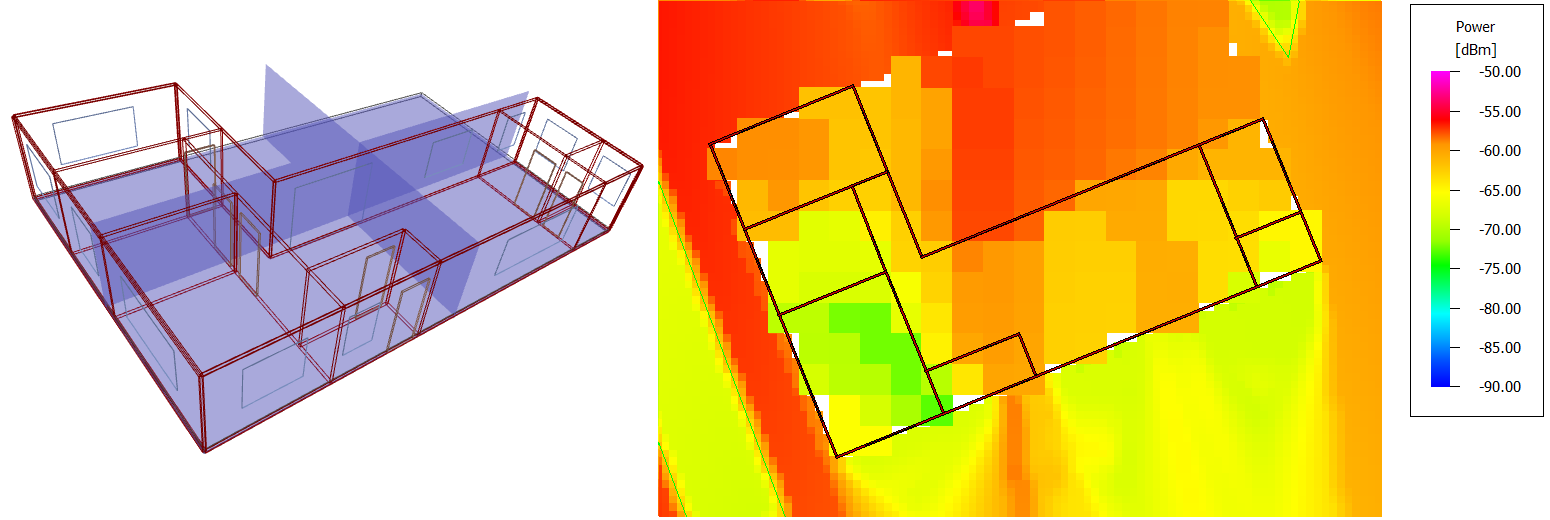
Figure 2. Power calculated using the dominant path model (DPM) for the indoor database.