The network planning of a local area network planning project in an indoor scenario is investigated. The model is
a multi-floor building. The dominant path model (DPM) method is used.
The network planning of a local area network in an indoor scenario is investigated. The model is a multi-story building.
The intelligent ray tracing model (IRT) method is used.
The network planning of a local area network in an indoor scenario is investigated. The model is a multi-floor building.
The multi-wall model (COST 231) method is used.
Perform network analysis for a WiMAX air interface in a rural/suburban scenario for fixed communications, such as
“the last mile” to a residential internet subscriber.
WinProp is a complete suite of tools in the domain of wireless propagation and radio network planning. With applications
ranging from satellite to terrestrial, from rural via urban to indoor radio links, WinProp’s innovative wave propagation models combine accuracy with short computation time.
View the typical workflows when working with propagation simulations in specific scenarios, how to add a network planning
to a propagation simulation, include a receiver pattern, set up a time-variant scenario, include multiple-input multiple-output
(MIMO) at both the base station and the mobile station, connectivity analysis of sensor networks and optimization.
Use AMan to generate, edit and analyze a single antenna. Superimpose multiple antennas radiating similar signals to determine
the actual antenna pattern while taking into consideration the local environment.
WinProp includes empirical and semi-empirical models (calibration with measurements possible), rigorous 3D ray-tracing models
as well as the unique dominant path model (DPM).
In WinProp various air interfaces and applications are pre-defined: broadcasting, cellular, wireless access, WiFi, sensor networks,
ICNIRP and EM compliance.
The network planning of a local area network planning project in an indoor scenario is investigated. The model is
a multi-floor building. The dominant path model (DPM) method is used.
The network planning of a local area network planning project in an indoor scenario
is investigated. The model is a multi-floor building. The dominant path model (DPM) method
is used.
Sites and Antennas
There are eight antenna sites at different locations and elevations in the building
for best signal coverage. Each antenna site has one isotropic antenna. They are
placed at four levels of height, that are 2.5 m, 6.2 m, 9.9 m, and 13.6 m. Four
different carrier frequencies around 2.4 GHz are used to minimize interference.
Four prediction heights are specified.
Tip: Open the Edit
Project Parameter dialog and click the
Simulation tab.
The heights are typed in the
Height field with a space between the values as
follows:
1.500 5.200 8.900 12.600
Air Interface
The wireless local area network (WLAN) air interface is defined by an 802.11g
wireless standard (.wst) file. OFDM/SOFDMA (orthogonal
frequency-division multiplexing) is selected for multiple access. It uses time
division duplex (TDD) for switching between uplink and downlink. With this
definition, only downlink carriers are defined since uplink and downlink are
separated in time. In this model, the adaptive switching method is used depending on
traffic load.
Tip: Click Project > Edit Project Parameter and click the Air Interface tab to view
the carriers and transmission modes.
Computational Method
As the model is a large multi-floor building, the preferred computation method is the
DPM. The DPM focuses on the most relevant path, which
leads to shorter computation times than standard ray tracing model (SRT).
Tip: Click Project > Edit Project Parameter and click the Computation tab to change
the model.
Results
Propagation results show the power received from each transmitting antenna at every
location. Results were computed for several prediction levels. When viewing results,
these levels can be selected from the drop-down list.
The type of network simulation used is a static simulation (homogeneous traffic per
cell). The network simulation calculates results like cell area, site area, best
server, and maximum data rate. The network simulation calculates the maximum
receiver power and the maximum signal-to-noise-and-interference ratio (SNIR) for all
modulation and coding schemes used in this model, for both downlink and uplink.
As an example, the image below shows the uplink SNIR, at the prediction height 8.9 m,
for one of the modulation schemes.
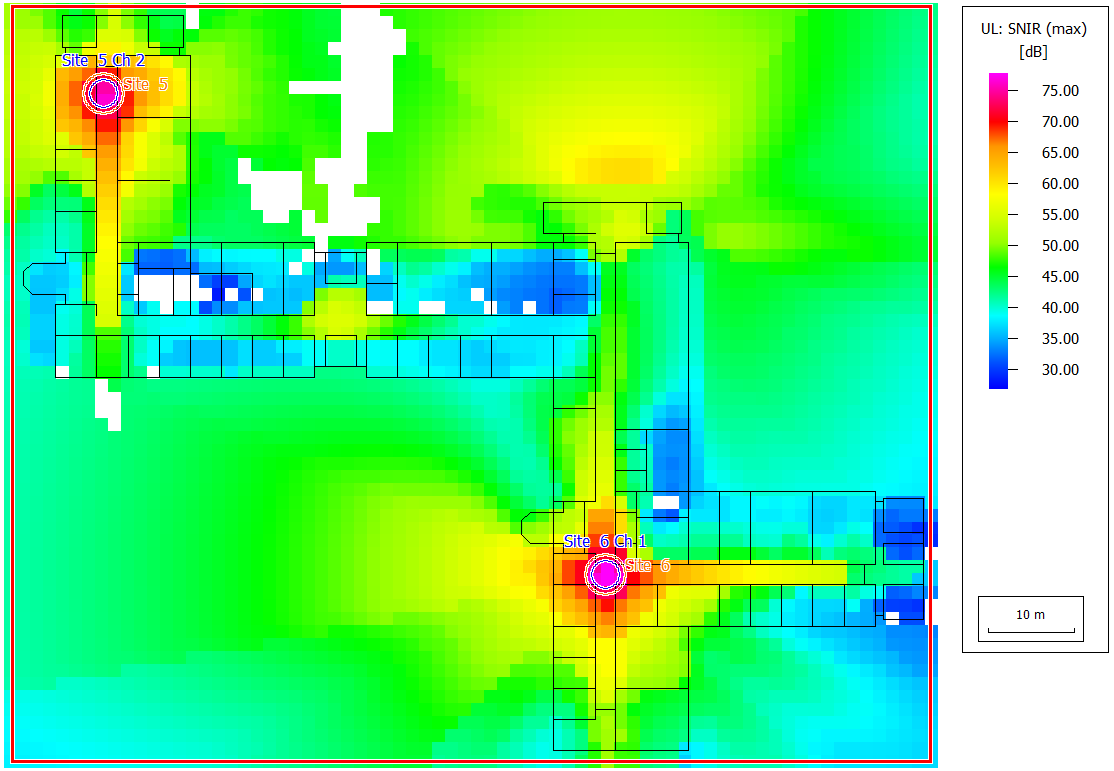