Result Types
A set of result types is available for each of the four analysis stages: injection, foaming, curing and defects.
Injection Results
Review material behavior through the injection stage. Result types for this stage include: Temperature, Head ID, Material ID, Density, Polyol [mg KOH], Pressure, Velocity, Mold Temperature, Isocyanate [wt%], and Viscosity.
| Result Type | Description |
|---|---|
| Temperature | Review the temperature evolution of the material entering the
part cavity. Check regions for excessive heating or cooling.
Determine the appropriate fill speed for uniform temperature
distribution.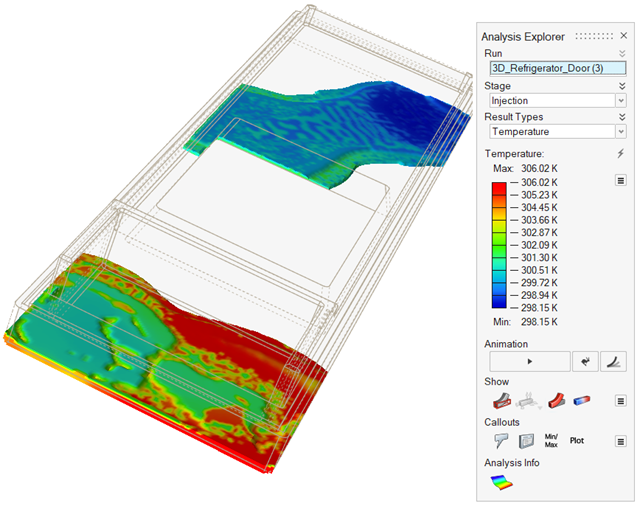 |
| Head ID | Review injection results for material coming from a
particular nozzle.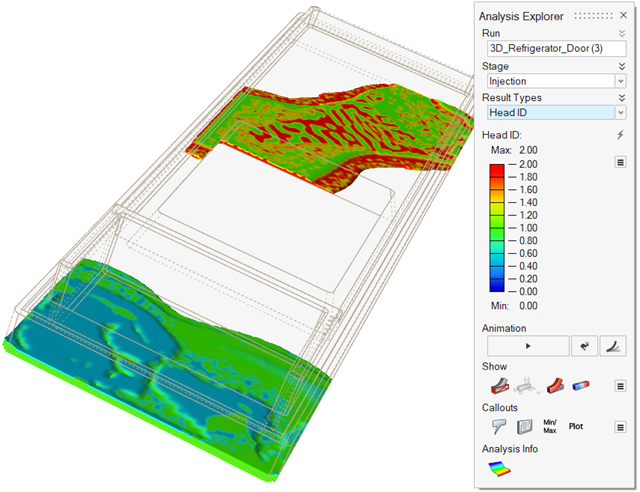 |
| Material ID | Review results for a particular material. Click the
Show and
Options buttons to change to
velocity, contour-fill animation.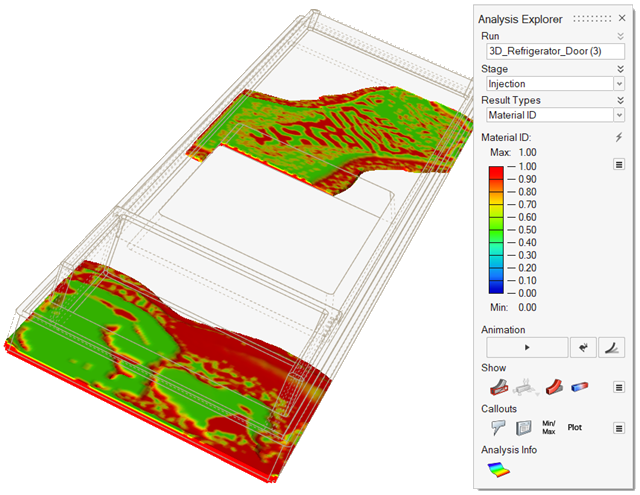 |
| Density | Consider material density through the progression of the
injection stage.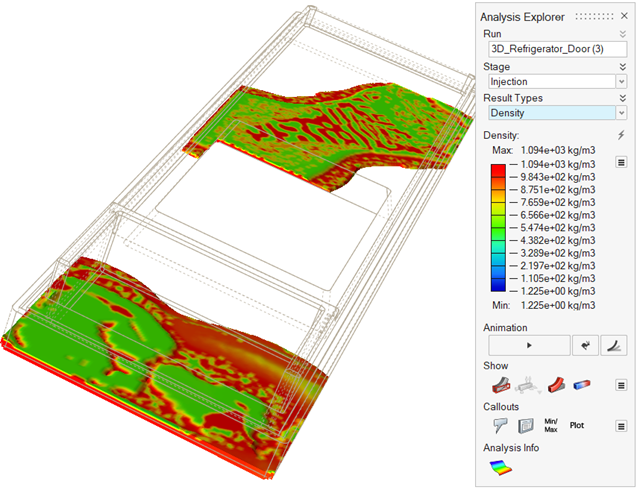 |
| Polyol [mg KOH] | Review the levels of polyol that remain in the
material.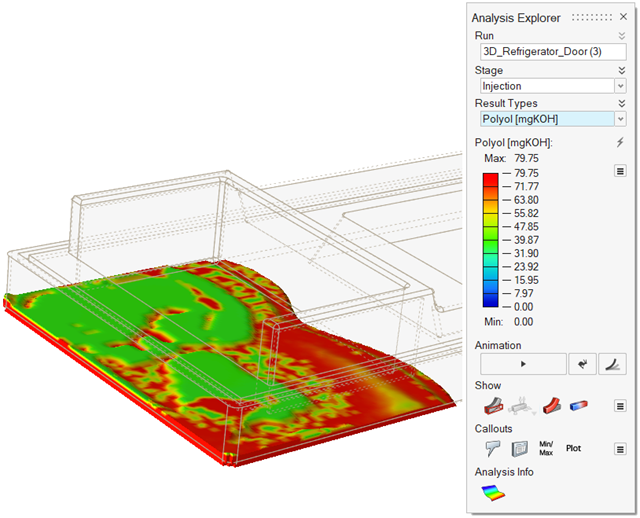 |
| Pressure | Review the impact of pressure on the material during the
injection stage.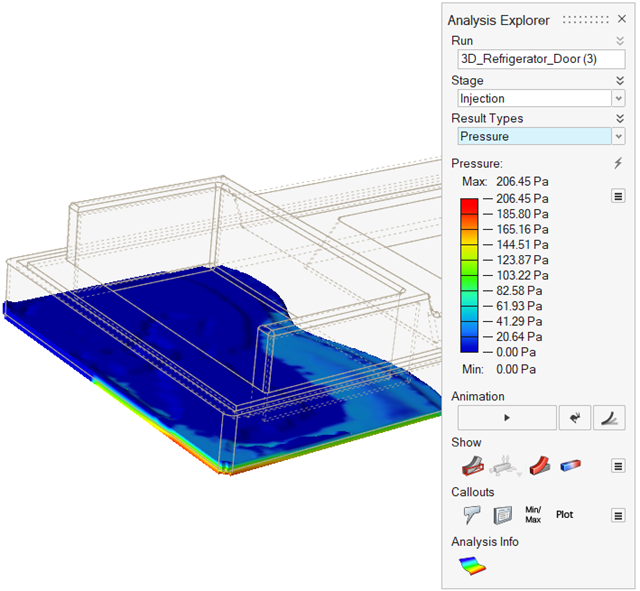 |
| Velocity | Review the filling process, which is represented with
vectors, to detect turbulences and velocities in the
material.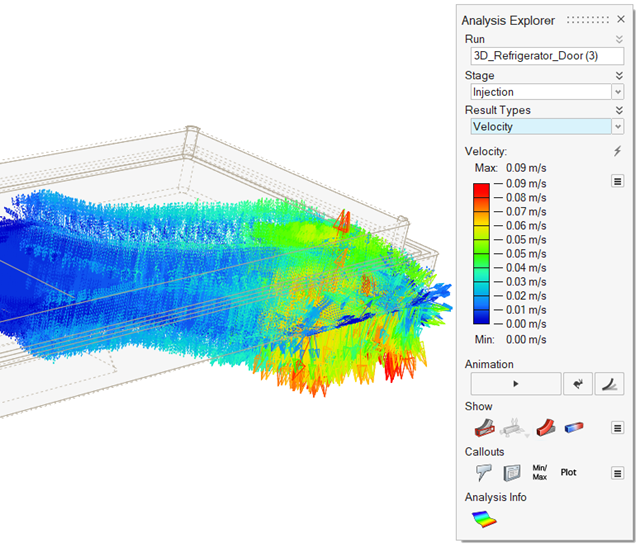 |
| Mold Temperature | Review the temperature variance in the mold throughout the
injection stage.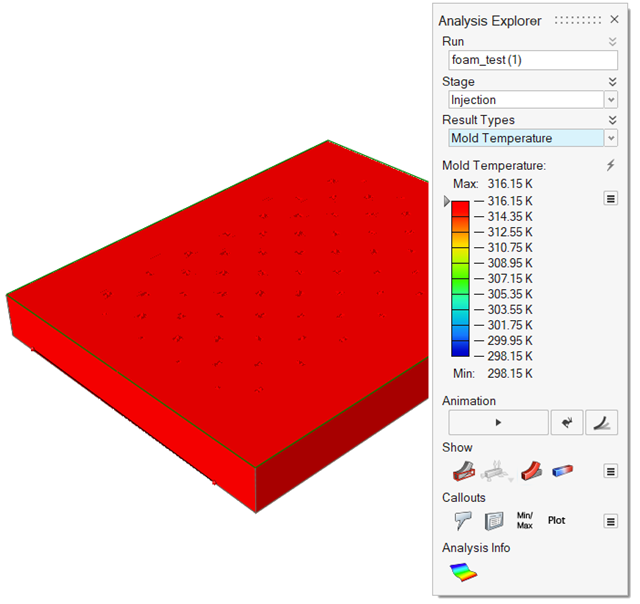 |
| Isocyanate [wt%] | Review the of isocyanate levels that remain in the
polyurethane material.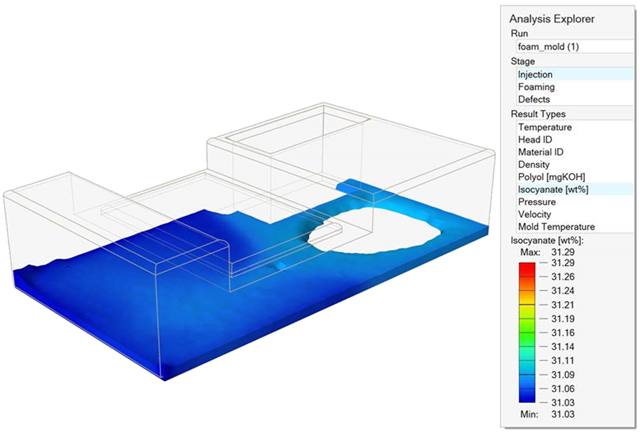 |
| Viscosity | Review the dynamic viscosity of the polyurethane material. |
Foaming Results
Review material behavior through the foaming stage. Result types for this stage include: Temperature, Head ID, Material ID, Density, Polyol [mg KOH], Pressure, Velocity, Isocyanate [wt%], and Viscosity.
| Result Type | Description |
|---|---|
| Temperature | Review the temperature evolution of the material during the
foaming stage.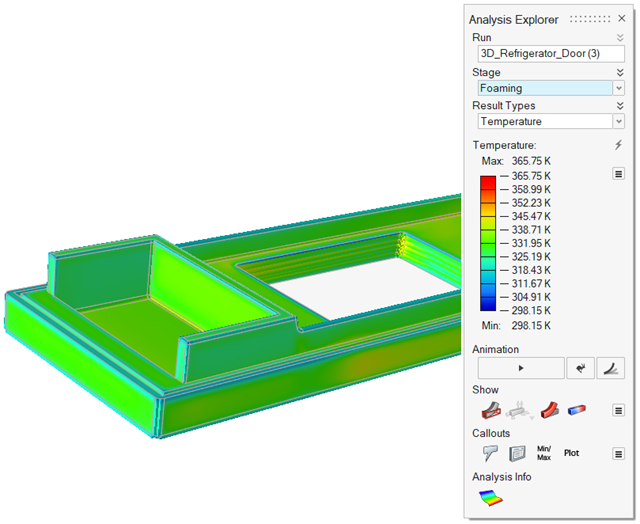 |
| Head ID | Review the foaming results for material coming from a
particular nozzle.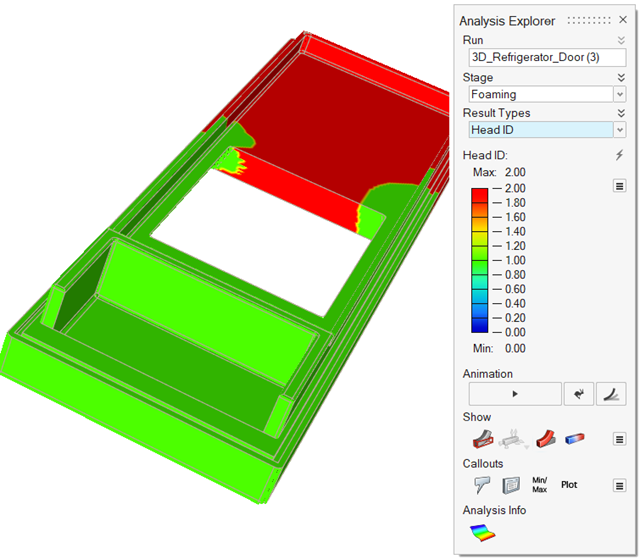 |
| Material ID | Review results for a particular material.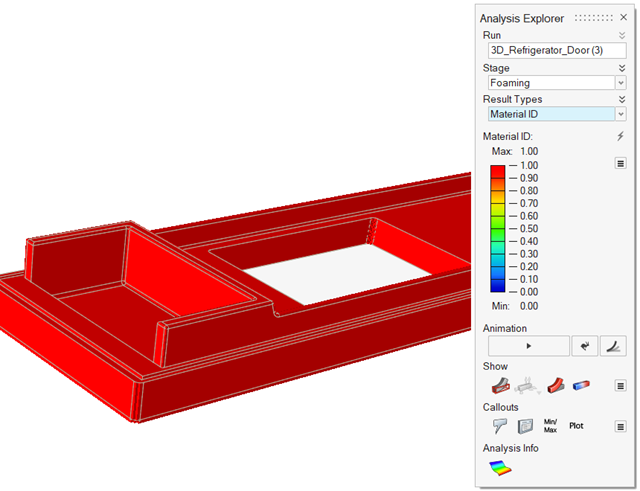 |
| Density | Consider material density through the progression of the
foaming stage.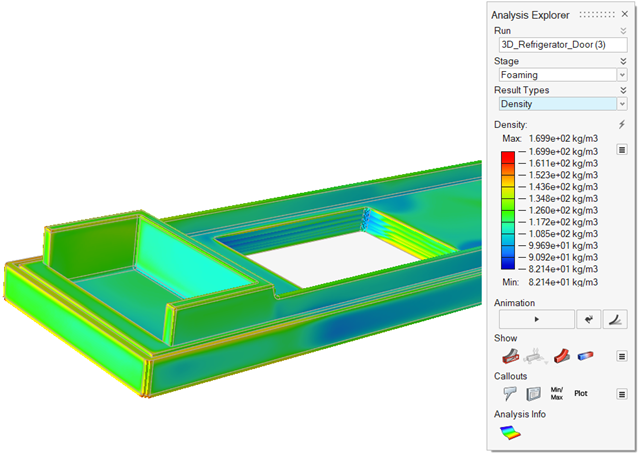 |
| Polyol [mg KOH] | Review levels of polyol in the material.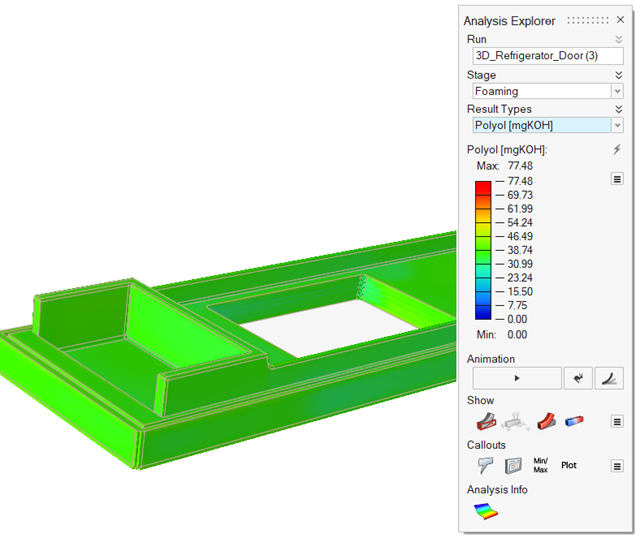 |
| Pressure | Review the impact of pressure on the material during the foaming stage. 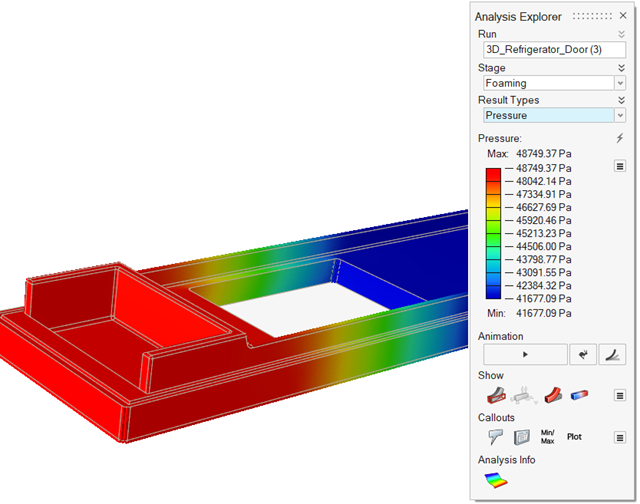 |
| Velocity | Review the foaming process, which is represented with vectors, to detect turbulences and velocities in the material. 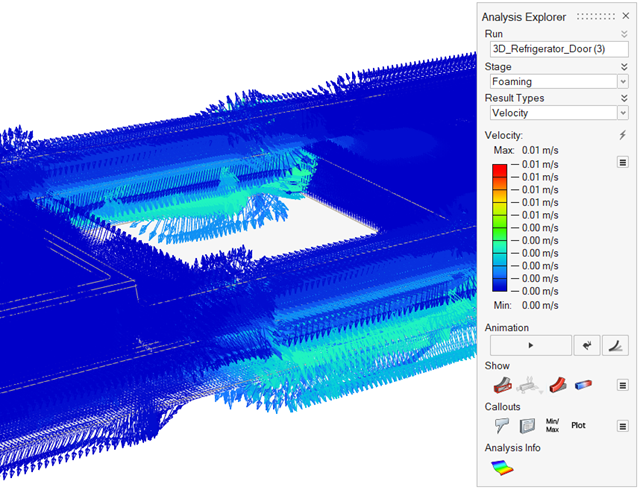 |
| Isocyanate [wt%] | Review the of isocyanate levels that remain in the
polyurethane material.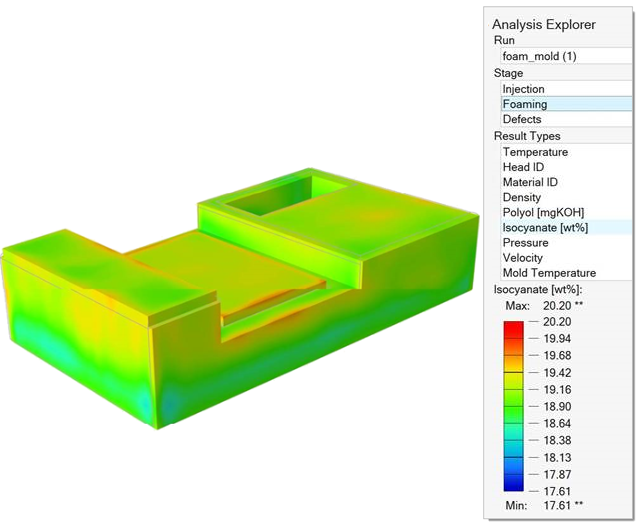 |
| Viscosity | Review the dynamic viscosity of the polyurethane
material.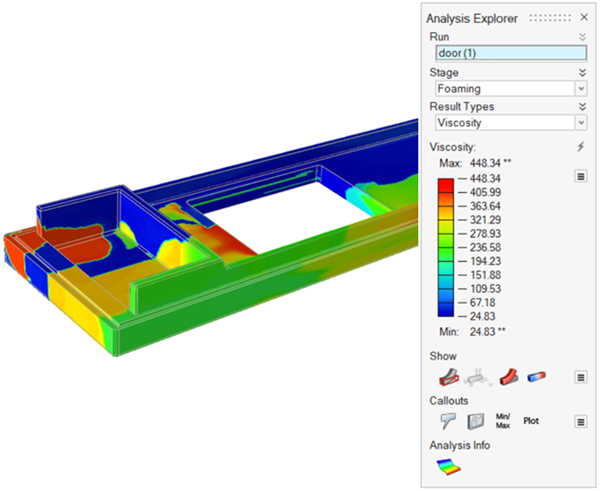 |
Curing Results
Review material behavior through the curing stage. Result types for this stage include: Temperature, Head ID, Material ID, Density, Polyol [mg KOH], Pressure, Isocyanate [wt%], and Viscosity.
| Result Type | Description |
|---|---|
| Temperature | Review the temperature evolution of the material during the
curing stage. Check regions for excessive heating or
cooling.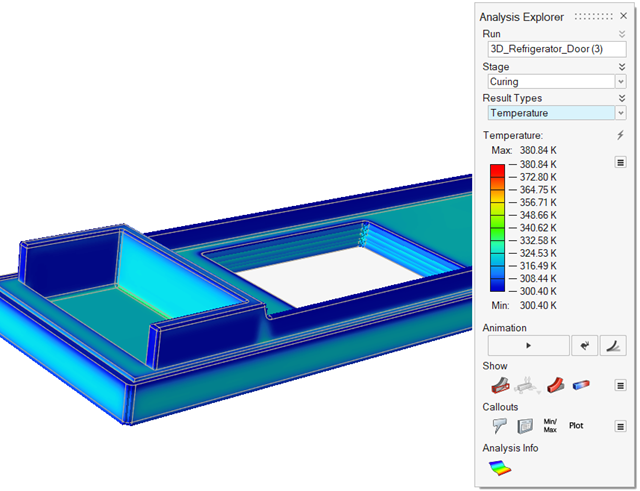 |
| Head ID | Review curing results for the material coming from a
particular nozzle.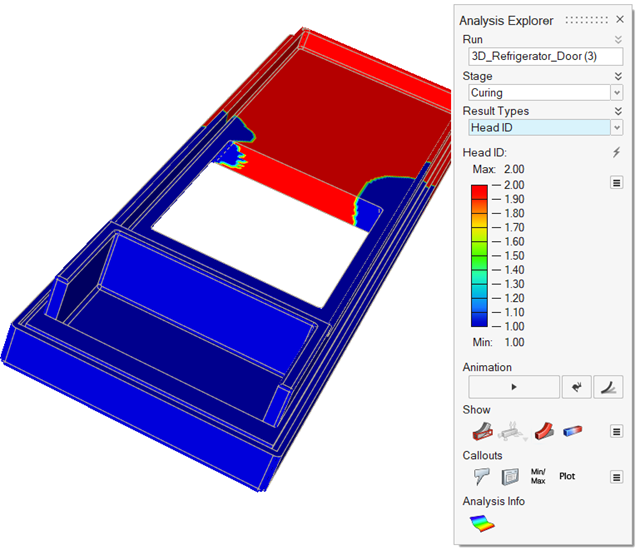 |
| Material ID | Review the curing results for a particular material.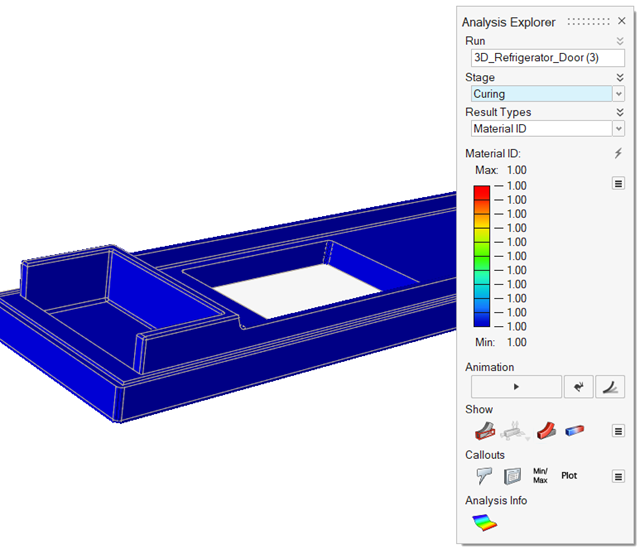 |
| Density | Consider material density during the curing stage.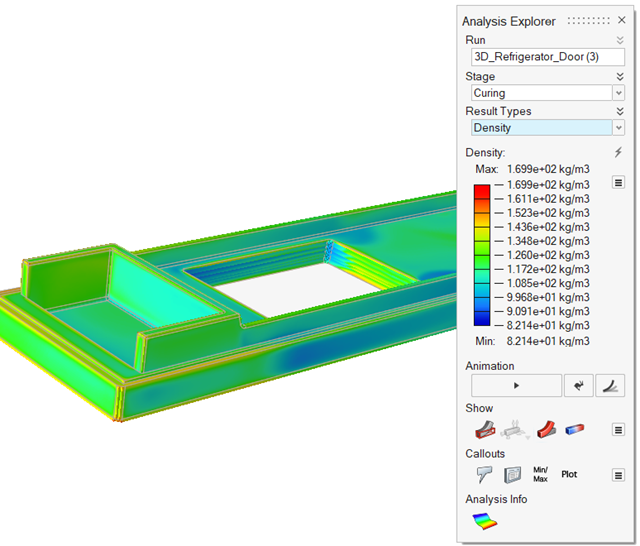 |
| Polyol [mgKOH] | Review levels of polyol in the polyurethane material.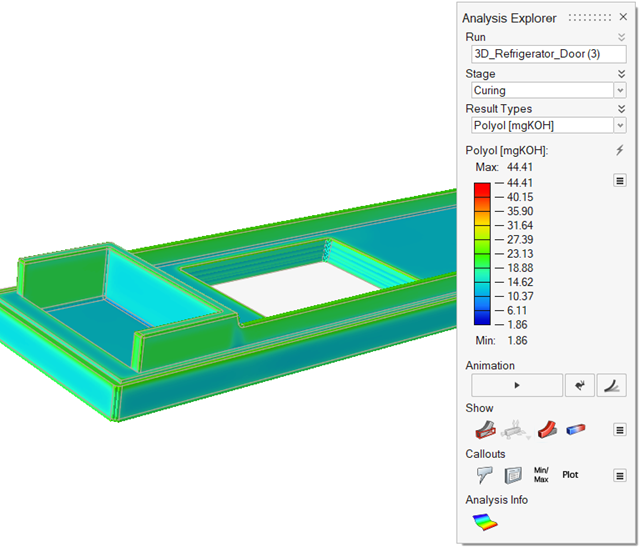 |
| Pressure | Review the impact of pressure on the material during the
curing stage.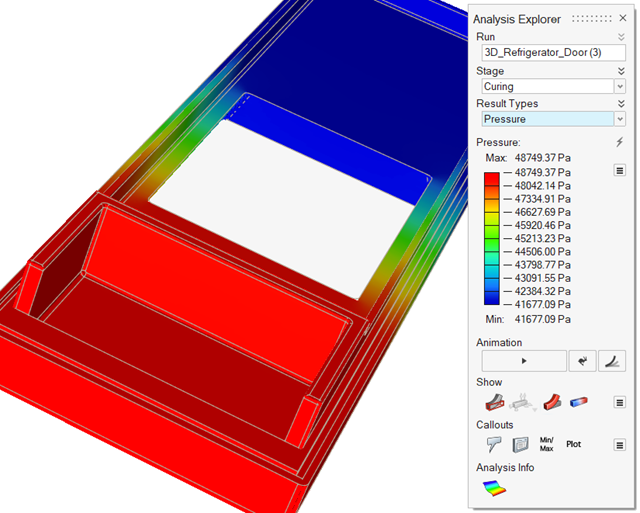 |
| Isocyanate [wt%] | Review the of isocyanate levels that remain in the
polyurethane material.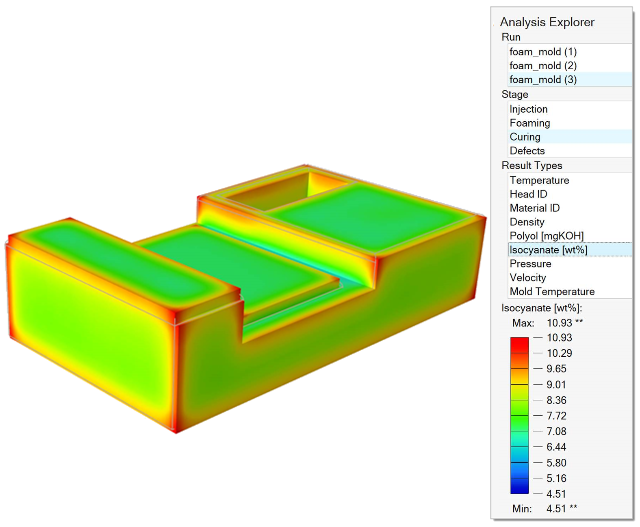 |
| Viscosity | Review the dynamic viscosity of the polyurethane material. |
Defects Results
Review a range of defects that can occur at the end of the foaming process. Result types for this stage include: Air Pressure, Filling Time, Surface Defect Modulus, and Shrinkage Defect Modulus.
| Option | Description |
|---|---|
| Air Pressure | Display the accumulated air pressure effects on the part at
the end of the simulation. Look for porosity and void
defects.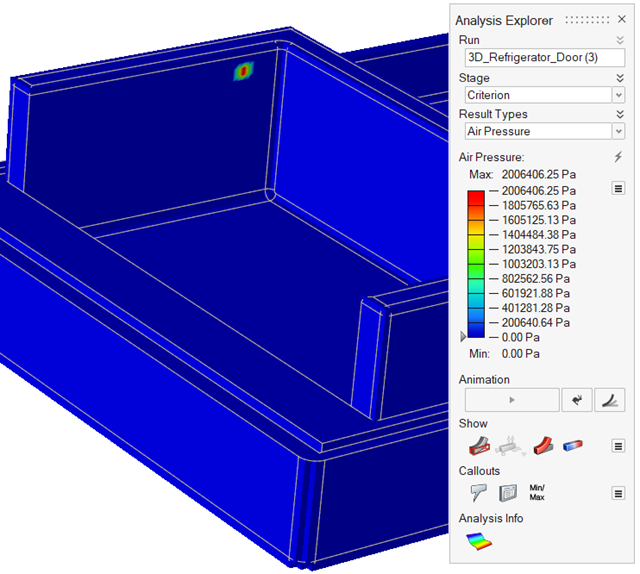 |
| Filling Time | Review the time the material takes to reach different areas of the mold. Consider adjustments to the nozzle paths and tooling. 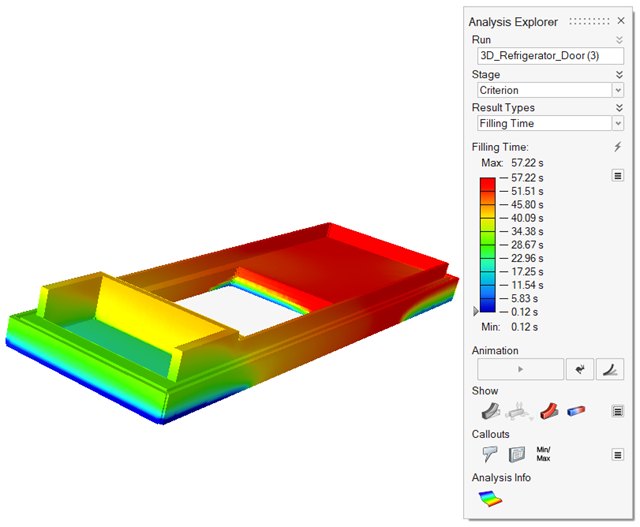 |
| Option | Description |
|---|---|
| Surface Defect Modulus | Review the surface of the foam part for coarseness, toughness
and melting that could be due to high mold temperatures, poor
sealing, undried demolding spray, or contaminants. Consider
controlling the mold temperature or modifying the sealing
process. These surface defects can occur when a highly viscous
foam flows through the mold.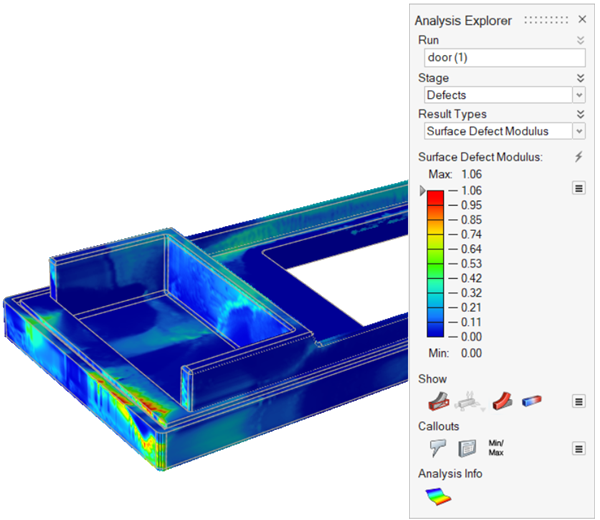 |
The Surface Defect Modulus is dimensionless, and the result
is displayed only on the surface between the part and mold. The
following example, where (a) is 20℃, (b) is 40℃, and (c) is 60℃,
shows a defect area that increases as the mold temperature
increases.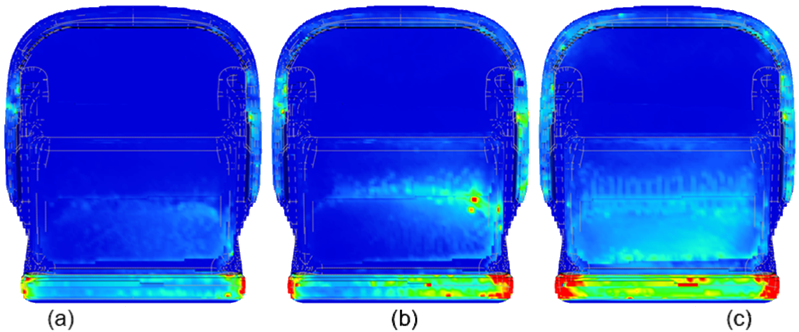 |
|
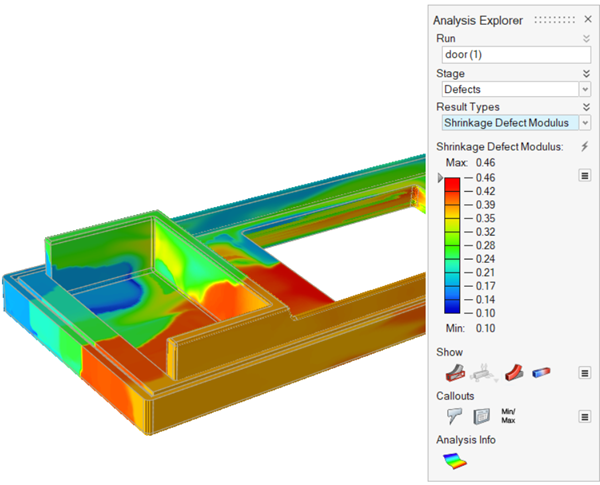
| Shrinkage Defect Modulus | To produce results that predict the Shrinkage Defect Modulus,
you must select Time as an ending
condition when defining the Process Parameters for your
analysis. A shrinkage defect can occur if the polyurethane
foam is too soft during the molding process or after
demolding. Shrinkage can occur due to over-packing, slow
gelling, and low index. Note that the shrinkage defect model
is appropriate for flexible, polyurethane foam only, not
rigid polyurethane foam.
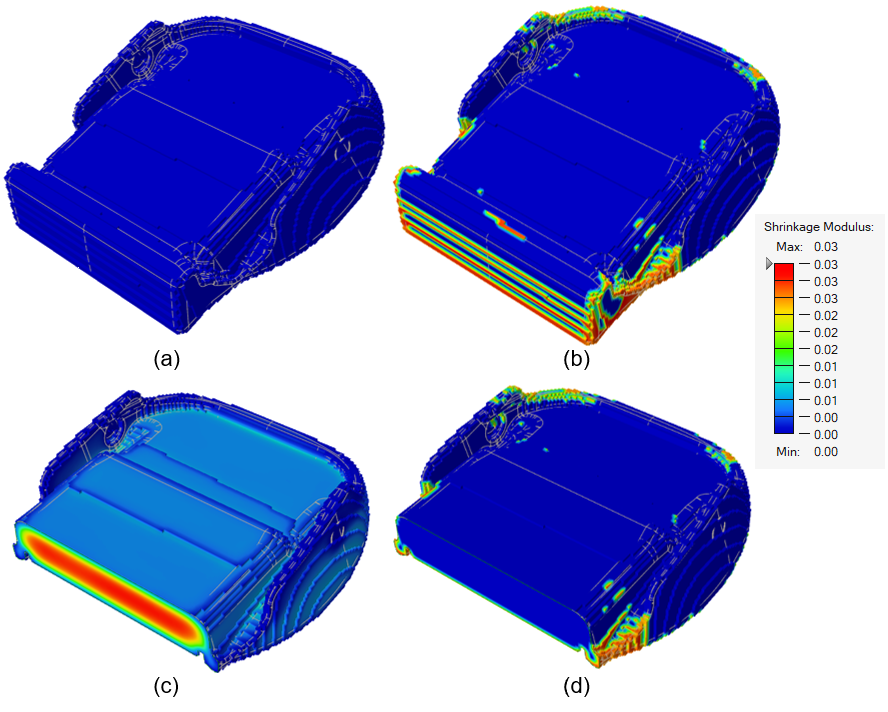
 The following examples show model results where (a) the mold is 40℃, (b) the mold is 20℃, (c) the temperature is shown through the cross-section of the part, and (d) the mold is 20℃ and the shrinkage modulus is shown. No shrinkage occurs when
the mold temperature is 40℃ (a). However, when the mold
temperature dips to 20℃, shrinkage occurs as shown in (b).
Looking at the cross-section (c), shrinkage occurs mainly on
the outer surface of the part because the surface
temperature is lower than the core temperature.
 |