Show Analysis Results
Analyze the results to minimize defects and prevent problems.
Results must be available in the Run History before viewing.
-
On the Analysis icon, click Show Analysis
Results.

-
Analyze the run.
Tip: To see what areas on your model are under the greatest stress, select and drag the results slider. To restore the result slider's default values, click
 .
. 
Result Types
Results are available for filling, packing, cooling, and warpage analysis stages.
Filling Results
| Option | Description |
|---|---|
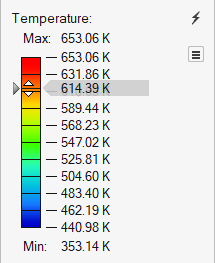
| Temperature |
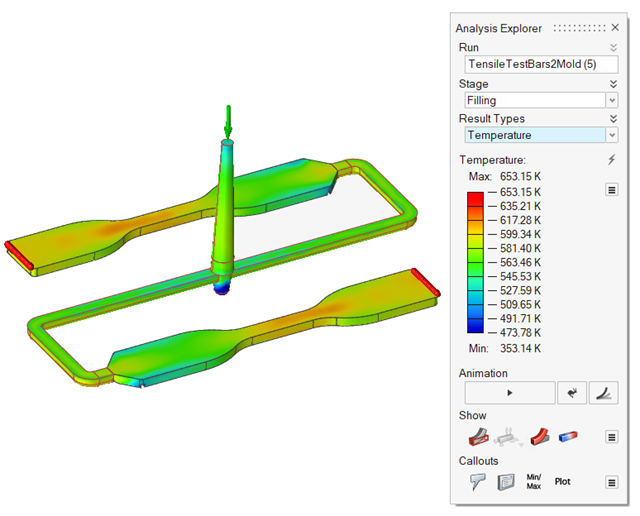 |
| Flow Front Temperature | Review the temperature at the time of filling.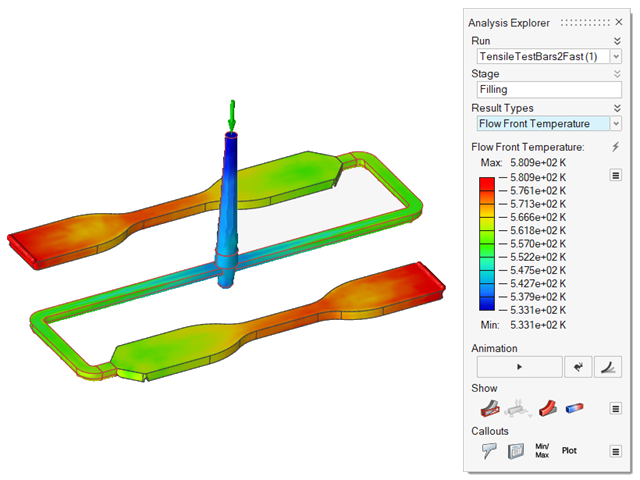 |
| Velocity |
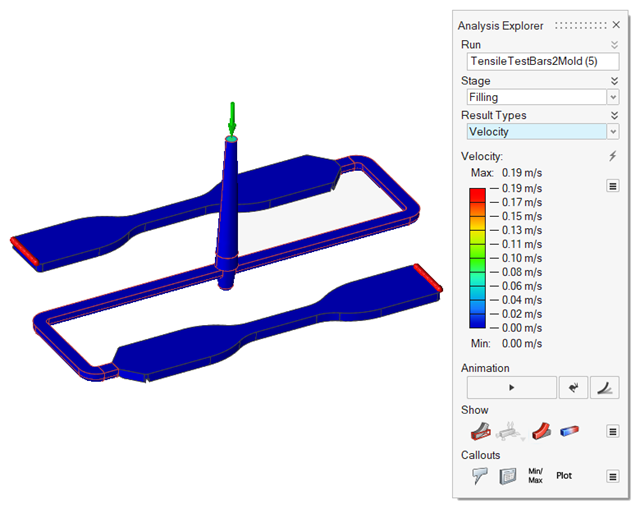 |
| Pressure | Review pressures inside the mold cavity produced during the
filling stage.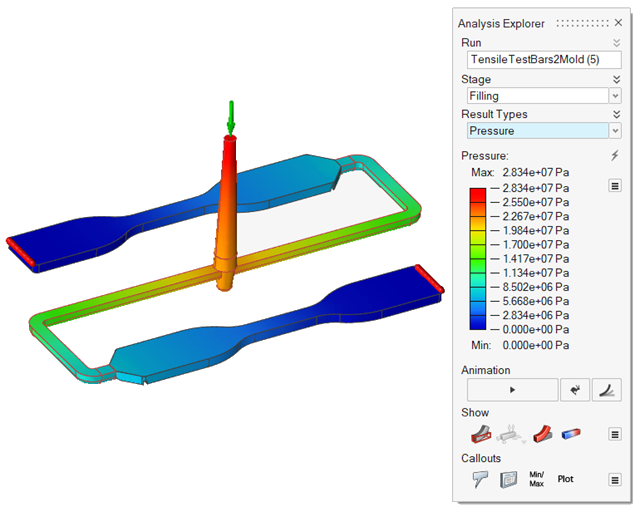 |
| Filling Time | Review the time it takes the material to reach different
areas within the part. The filling results can help you
determine the best way to fill the part and detect patterns that
indicate the potential for incomplete filling, unbalanced flow,
weld lines and air pockets.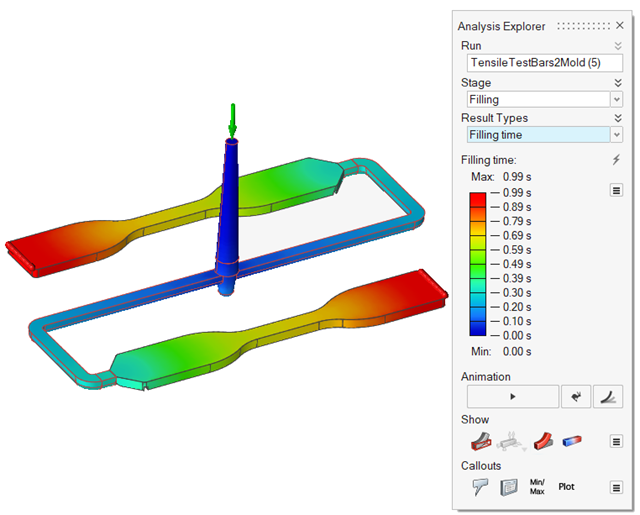 |
| Air Traps |
 |
| Weld Lines | Locate regions during filling where two flow fronts meet.
Such regions may cause structural and cosmetic issues.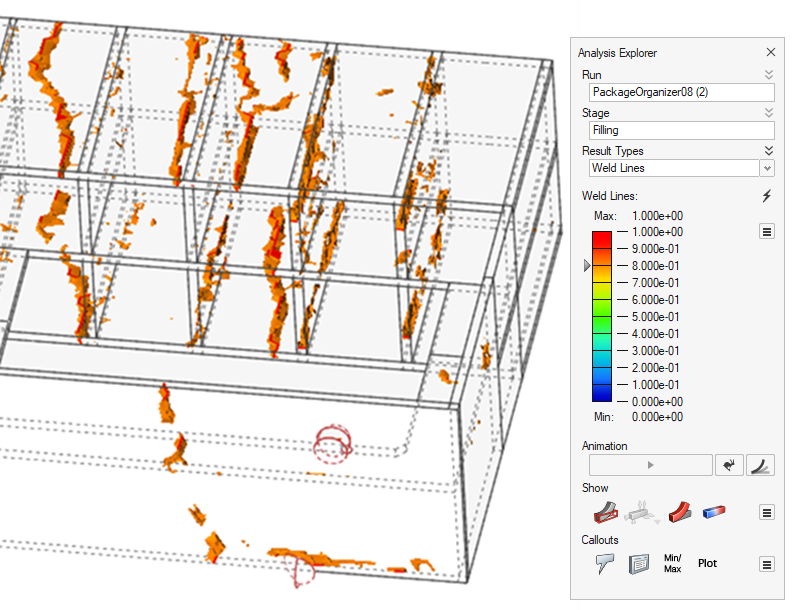 |
| Mold Temperature | Review temperature variances in the mold.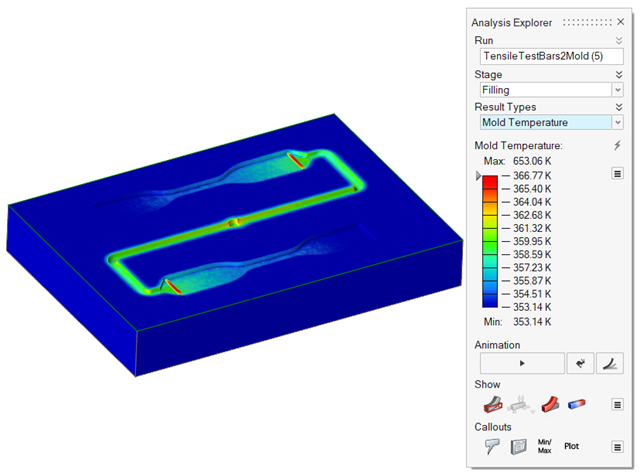 |
| Fiber Orientation Tensor | Review diagonal and cross products results for the tensors.
The result predicts the fiber orientation tensor for short fiber
reinforced polymers.
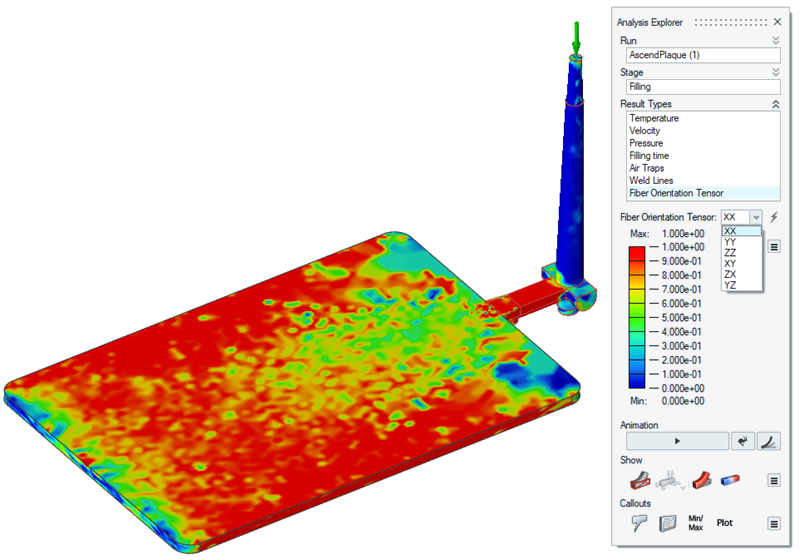 |
Packing Results
| Option | Description |
|---|---|
| Temperature | Review temperatures during the packing phase. The temperature
will decrease due to the temperature loss across the mold
walls.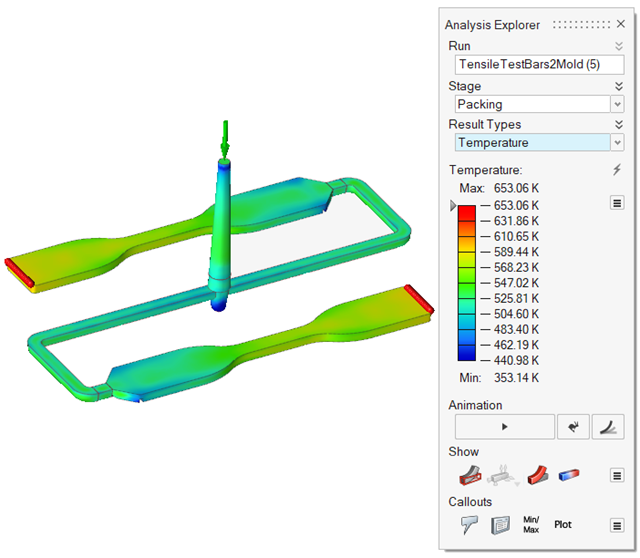 |
| Velocity | Examine velocity during the packing phase. Velocities will
decrease until the fluid stops flowing. |
| Pressure | Consider pressures during the packing phase. These results
are useful to know points where the pressure is less than 0 to
detect areas prone to suffer a sink mark defect.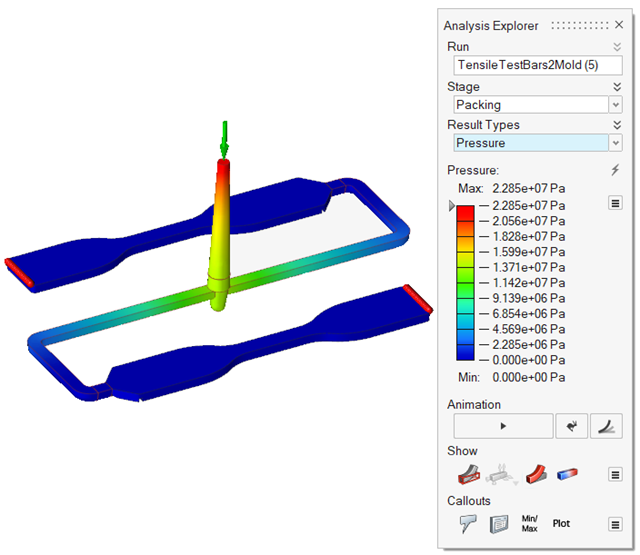 |
| Sink Marks | Detect surface depressions, usually in the thicker sections
of the model, caused by shrinkage during the packing
stage.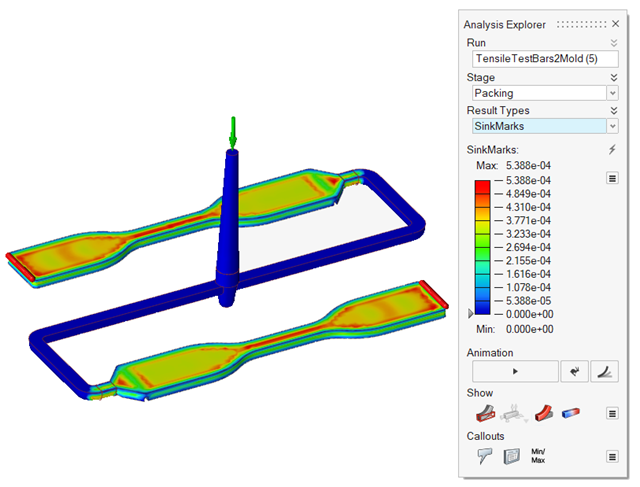 |
| Mold Temperature | Review temperature variances in the mold.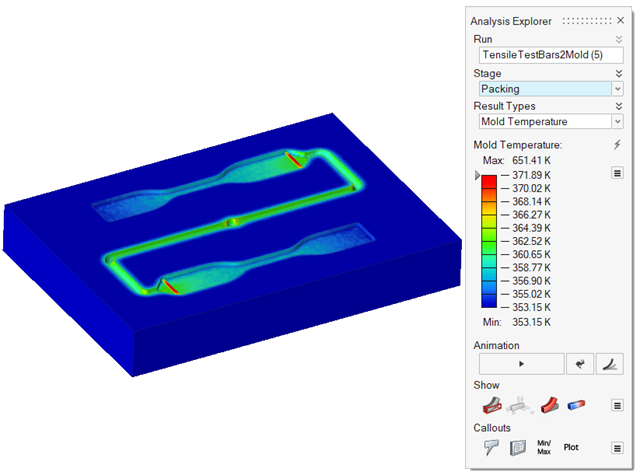 |
Cooling Results
| Option | Description |
|---|---|
| Temperature | Examine the temperature evolution once the mold is totally
filled. You can determine the final temperature at which to stop
the cooling phase.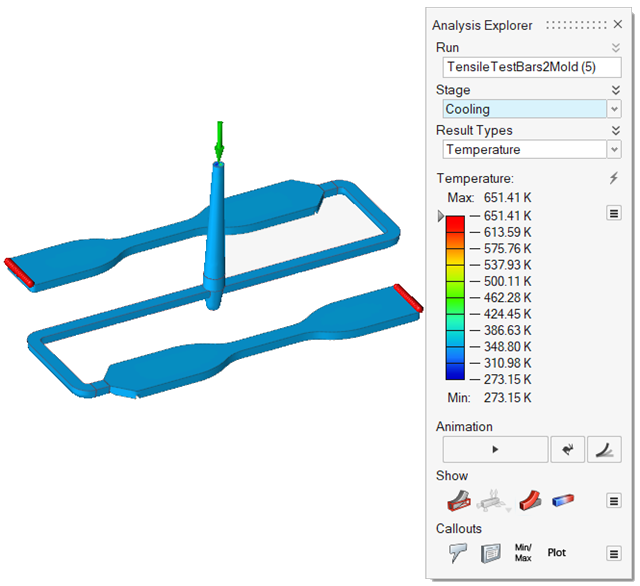 |
| Mold Temperature | Review temperature variances in the mold.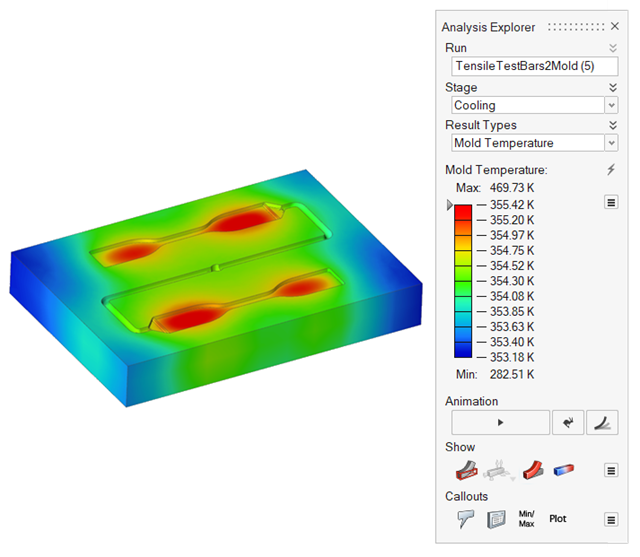 |
Warpage Results
| Option | Description |
|---|---|
| Displacement | Detect folding, bending, twisting or bowing in the molded
part, which is usually due to non-uniform cooling. The
displacement contour displays how the part is warping so that
you can make the appropriate corrective measures to the cooling
rate, cooling channel design, or process data.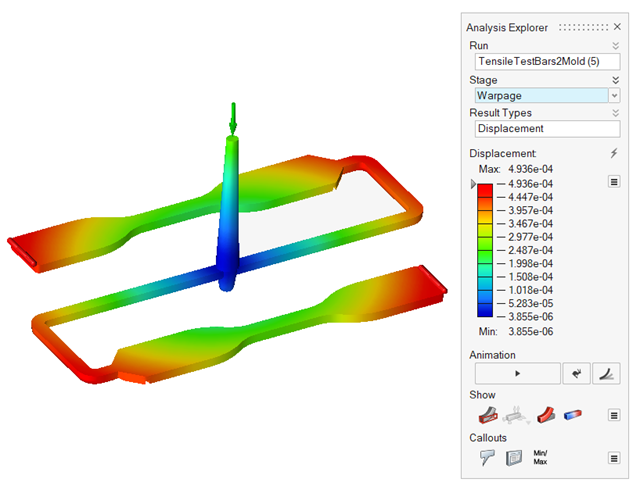 |
View Molding Defects
Fix issues with air traps, weld surfaces, and sink marks.
-
When the run is complete, click the Show Analysis
Results
icon or double-click the run the in Run
Status window to view the results.
-
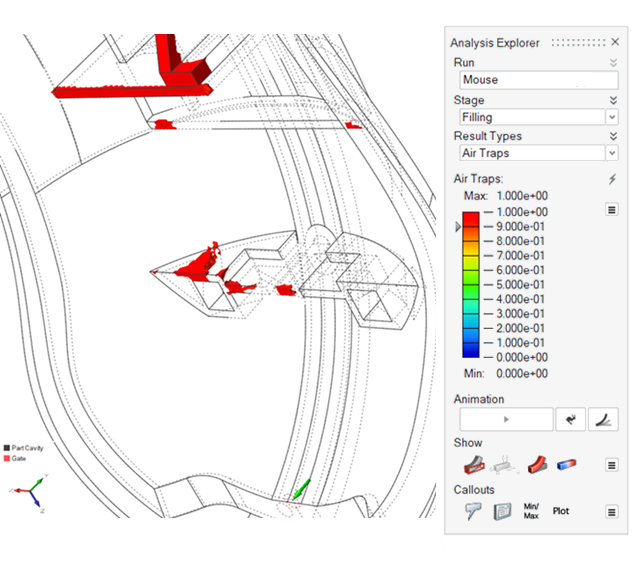
In the Analysis Explorer select the
Filling stage, then view the results for
Air Traps. This defect occurs when there is not
enough venting, and air gets trapped in the mold.
Note: To fix issues with air traps:- Optimize your design to create appropriate gating.
- Select low viscous materials, which will allow more air to be released.
- Add proper ventilation.
- Align your mold properly to help provide ventilation for trapped air.
-
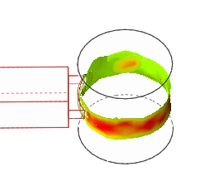
Next, view Weld Surfaces for the Filling stage. This
simulation shows the regions where two flow fronts meet. This defect can occur
in parts with a core or insert. If the two fronts that meet have different
temperatures, they may not meld completely in the mold because of a temperature
gradient.
Note: To fix issues with weld surfaces:- Select a material with a low melting temperature.
- Increase the injection temperature and speed.
- Modify the design to obtain a single flow.
- Increase the melting temperature of the material.
-
View Sink Mark results for the Packing stage. These
defects occur in the thicker sections of the model when the cooling rate and
compensation are not sufficient. Rib sections and internal fillets are the most
common areas to be affected.
Note: To fix issues with sink marks:- Redesign the thickest section where sink mark is occurring and try to reduce the thickness.
- During Packing, lower the mold temperature using the Cooling System.
- Increase the gate size to allow enough material to fill and pack the mold.
- Increase the holding temperature during the Packing cycle.
Add Callouts to the Results
Call out and review values for a selected result type at points of interest on your model using the callout icons in the Analysis Explorer.
-
To create a callout at a point of interest, click
 in the Analysis Explorer, select a
Result Type, and then click a point on your model.
Box-select to see the maximum value in an area.
Note: The callout value applies to the currently selected run.
in the Analysis Explorer, select a
Result Type, and then click a point on your model.
Box-select to see the maximum value in an area.
Note: The callout value applies to the currently selected run. -
To automatically create callouts showing where the minimum and maximum values
occur for a result type, select a Result Type, and then
click
 .
.
- Optional:
To display callouts in a table, click
 in the Analysis Explorer.
- Selecting a row in the table also selects the callout in the modeling window.
- To show or hide a single callout, in the Callouts table, Name column,
click
 .
. - To show or hide all callouts, in the Analysis Explorer, click .
- To sort the order of a column in the table, click the column header. Or
you can click
 or
or  to select Sort
Ascending or Sort Descending.
to select Sort
Ascending or Sort Descending.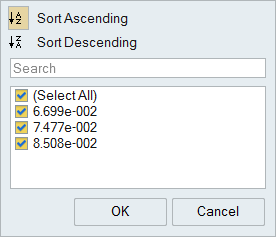
- To add or delete columns on the table, right-click a column header, and then select or deselect a property.