Analysis Explorer
Use to view the results of a thinning analysis. You can view thinning percentage, formability, and thickness results for a selected run and load case.
-
Click the Show Analysis Results tool on the
Thinning icon.
 The Analysis Explorer opens.
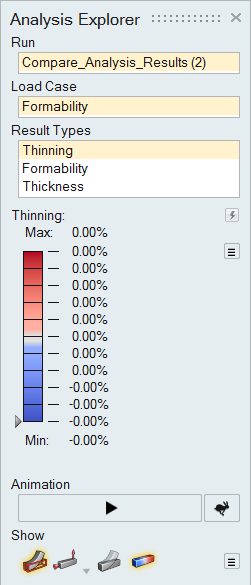
-
Click on a Result Type to view the results. Stamping
feasibility analysis produces three different result types for each load
case.
- Thinning is the ratio of the change in thickness and the original thickness expressed as a percentage. A positive thinning percentage indicates a reduction in thickness. This could be a concern for the performance of the part under fatigue loading since thinner regions in the part will undergo higher stresses compared to the rest of the part. A negative thinning percentage indicates thickening of the part in regions of compression. Excessive compression may lead to wrinkles on the sheet metal, resulting in poor surface quality.
- Formability is determined from the ratio of the principal strains (also known as major and minor strains) on the surface of the sheet metal. This gives a good measure of the formability of the part. The spectrum of colors indicates the stretch condition, with red areas under the highest amount of stretch and blue regions under the highest amount of compression.
- Thickness is a plot of the actual thickness distribution in the part. The thinning percentage is directly derived from the thickness distribution.
Note: In addition to the above results, you can visualize the flat geometry of the initial blank by clicking the button, which toggles between the initial and
final shapes. The initial shape is the minimum amount of material required
to stamp the final part.
button, which toggles between the initial and
final shapes. The initial shape is the minimum amount of material required
to stamp the final part. -
Use the scalable results slider to provide a color gradient for the selected
result type.
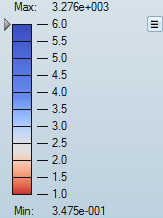
- To change the upper or lower bound for the results slider, click on the
bound and enter a new value. Click the reset
 button to
restore the default values.
button to
restore the default values. - To filter the results so that areas on the model with results greater than a specified value are masked, click and drag the arrow on the results slider.
- To change the legend color for the result type, click the
 icon next to
the results slider and select Legend Colors.
icon next to
the results slider and select Legend Colors. - To apply the min/max values for the current result type to all load
cases, click the icon next to the results slider and select
Apply current min/max to all load cases.
- To reset the min/max values for the current result types for all load
cases, click the icon next to the results slider and select
Reset min/max of all load cases.
- To change the upper or lower bound for the results slider, click on the
bound and enter a new value. Click the reset
-
Animate selected parts.
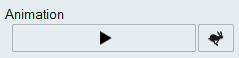
- Click on the Play button to animate the selected result.
- Click on the
 icon to change the speed of the
animation.
icon to change the speed of the
animation.
-
Use the icons under Show to determine what is made
visible in the modeling window for the analysis.
-
Show/hide the initial shape as a reference.
 Show/hide loads and supports. You can also show only the current loads
and supports.
Show/hide loads and supports. You can also show only the current loads
and supports. Show/hide the deformed shape as a reference.
 Show/hide contours. Click the icon to reveal additional options related to
contours. Select Interpolate during animation to
animate the result contour. Select Blended contours
to toggle between blended and nonblended contours.
Show/hide contours. Click the icon to reveal additional options related to
contours. Select Interpolate during animation to
animate the result contour. Select Blended contours
to toggle between blended and nonblended contours.