Viewing the Near Field Results (2D)
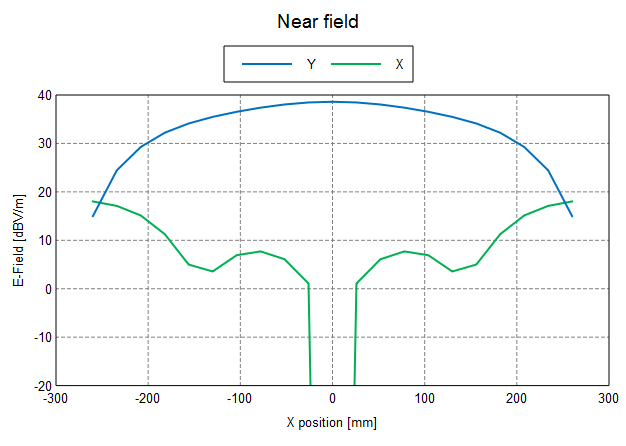
Create a new Cartesian graph. Create two near field traces and compare the Ey and Ex components of the near field along the X direction.
Create a new Cartesian graph.
-
On the Home tab, in the
Create new display group, click the
 Cartesian icon.
Add the near field result to the Cartesian graph.
-
On the Home tab, in the
Add results group, click the
 Near field icon. From the drop-down list, select
NearField1.
Near field icon. From the drop-down list, select
NearField1.
View the near field along the X direction.
-
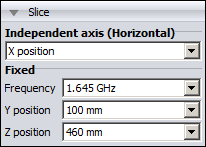
On the result palette, in the Slice
panel, make the following changes:
- From the Independent axis (Horizontal) list, select X position.
- From the Frequency list, select 1.645 GHz.
- From the Y position list, select 100 mm.
- From the Z position list, select 460 mm.
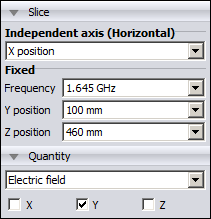
For the purposes of this example, the magnitude of the Ey component of the field is to be displayed.
-
On the result palette, in the quantity panel,
clear the X check box and the
Z check box.
Add a second trace to the Cartesian graph by duplicating the NearField1 trace.
-
On the Trace tab, in the
Manage group, click the
 Duplicate trace icon.
A second trace, NearField1_1, is created.
Duplicate trace icon.
A second trace, NearField1_1, is created.
For the purposes of this example, the magnitude of the Ex component of the field is to be displayed.
Over most of the aperture Ex is much smaller than Ey. It is therefore recommended to set the vertical axis to dB.
-
Select both traces (NearField1 and
NearField1_1) and on the result palette, in the quantity panel, select the
dB check box.

Modify the minimum and maximum values for the vertical axis.
-
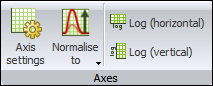
On the Cartesian
context tab, on the Display tab, on the Axes group, click the
 Axis settings icon.
- On the Axis settings (Cartesian graph) dialog, select the Vertical tab.
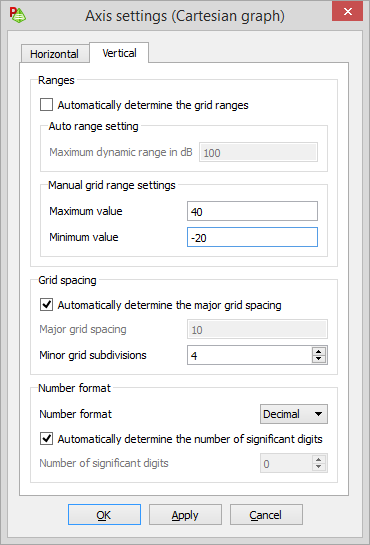
- Clear the Automatically determine the grid range check box.
- In the Maximum value field, enter a value of 40.
- In the Minimum value field, enter a value of -20.