Defining a Microsoft Template Using Rectangular Placeholders
Create a report template in Microsoft Office that uses rectangular placeholders to
create structured content that can be reused each time you generate a report.
Create a Microsoft PowerPoint (.potx) or Microsoft Word
(.dotx) template using one of the following
workflows:
Use one of the predefined templates provided by Microsoft.
Create a template with the required styling.
In POSTFEKO, decide on the graphs and 3D views to
be added to the report. For this example, the startup
model will be used. The required views are the 3D view and the graphs are
startup1, Cartesian graph1 and Smith chart1.
In Microsoft Word or Microsoft PowerPoint add “placeholders” to the
template.
Add a rectangle (Shapes) to the template for
each required graph. It acts as a placeholder for the graph.
Select a placeholder and from its right-click context menu
select Add text.
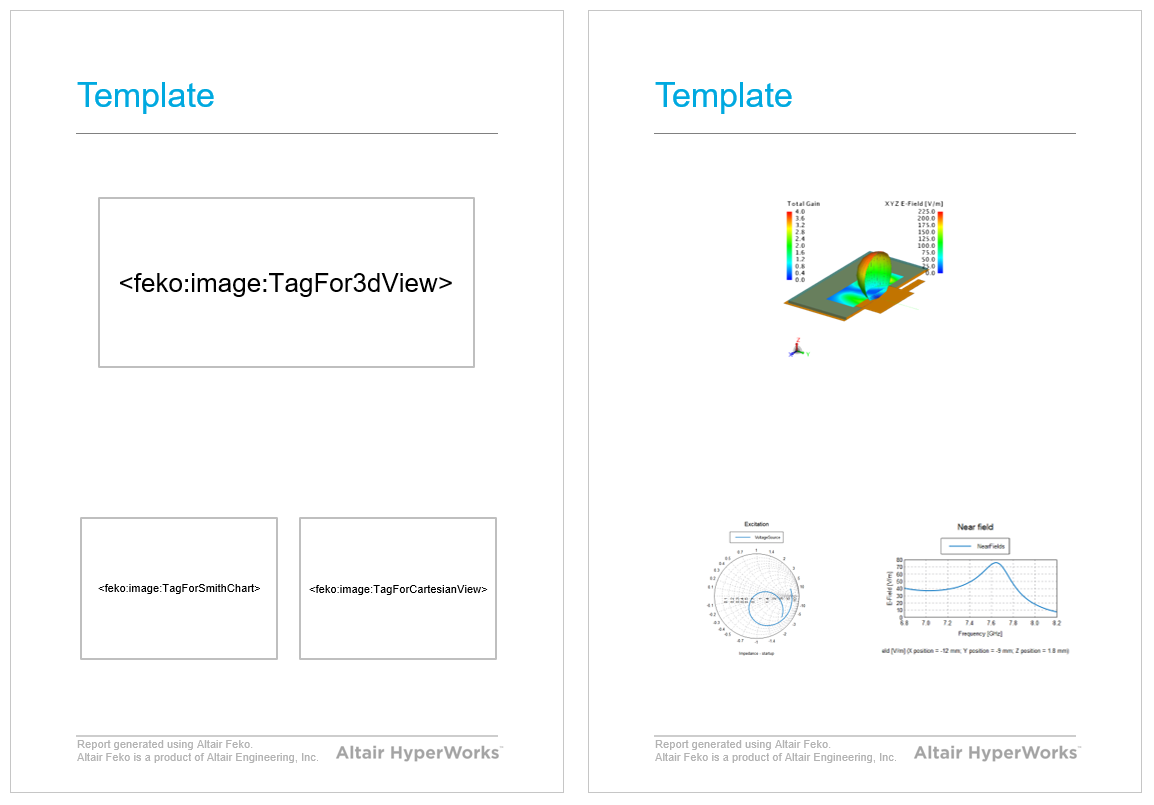
Add the text <feko:image:tag>, where tag is a
unique label linking to a specific graph or 3D view.
For this example, the startup model is used. The
required views are the 3D view and the graphs are:
startup1
Cartesian graph1
Smith chart1
[Optional] Add text descriptions and title for the graphs and 3D
views.
Figure 1. The template with “rectangular placeholders” at the positions in
the template where the 3D view and graphs will be
required and (b) the report that will be generated when using this
template.
Save the Microsoft PowerPoint (.potx) or Microsoft Word
(.dotx) template.