A Word Cloud chart is one of the easiest ways to get someone started on data visualization is to introduce them to word clouds (it also demonstrates neatly how not all data is numerical).
Word Cloud charts generate 'word clouds' from the text that you provide. The clouds give greater prominence to words that appear more frequently in the source text. You can tweak your clouds with different fonts, layouts, and color schemes.
Creating word cloud charts
1. On the toolbar, select + New Page from the Pages drop down, or on the Filters and Settings pane, select the Pages tabbed page and then click the + icon to create a new page.
2. Click
the ![]() icon in the chart area
and then select the Advanced tabbed page.
icon in the chart area
and then select the Advanced tabbed page.
3. Select
the Word Cloud chart type or click the icon at the top right corner of
the chart area and then select Word Cloud
to create a Word Cloud chart.
icon at the top right corner of
the chart area and then select Word Cloud
to create a Word Cloud chart.
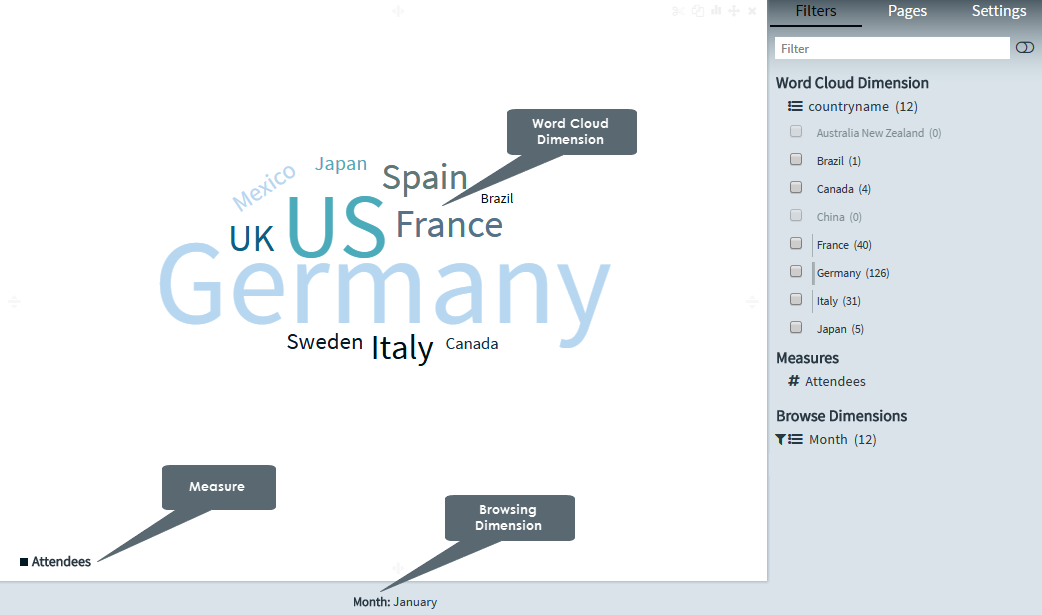
4. From the Dimensions pane, specify a wordcloudDim for the Word Cloud chart.
5. Specify a Measure for your chart.
Optionally, specify a Page Dimension for your chart.
6. In the Filters and Settings pane, select any of the following:
▪ Filters tabbed page to browse the chart dimensions using the Dimensions Browser.
▪ Pages to view all pages in the current report as thumbnails.
▪ Settings to define drill through, page, or report properties for the chart.
Before creating a visualization, it is recommended to select the Dimension Browser view by selecting the Filters tabbed page from the Filters and Settings pane. The Dimensions Browser enables you to easily drag and drop Dimensions or Measures from the Dimensions pane (depending on the chart type) into Dimensions, Measures, Legend, or Browsing Dimensions of the Dimension Browser.
Defining word cloud chart properties
Envision allows you to define chart properties such as the title text, font type, and color scheme.
The following table explains how to define these properties.
| For | Specify |
| Color Scheme | Select a color scheme from the list of available color schemes. |
| Data Format | Select a data format for the chart from the list that contains the default data format as well as the data formats that you have created. |
| Font Type | Select a font type for the words in the word cloud from the list of available font types. |
| Legend | Select the On check
box to display or hide the legend. Specify a location for the legend display (left, center, right). Specify the alignment for the legend text (left, center, right). Drag the Rows Visible indicator in the range 1-10 to display the number of visible legend rows. Select the font size for the legend (10,12,14), style (normal, italic), and weight (normal, bold) from the respective lists. For more information on configuring the legend settings, see Configuring Legend Settings. |
| Title | Specify a new title for your chart. Default value is 'My Chart'. |
|
|
Page Properties |
Report Properties |