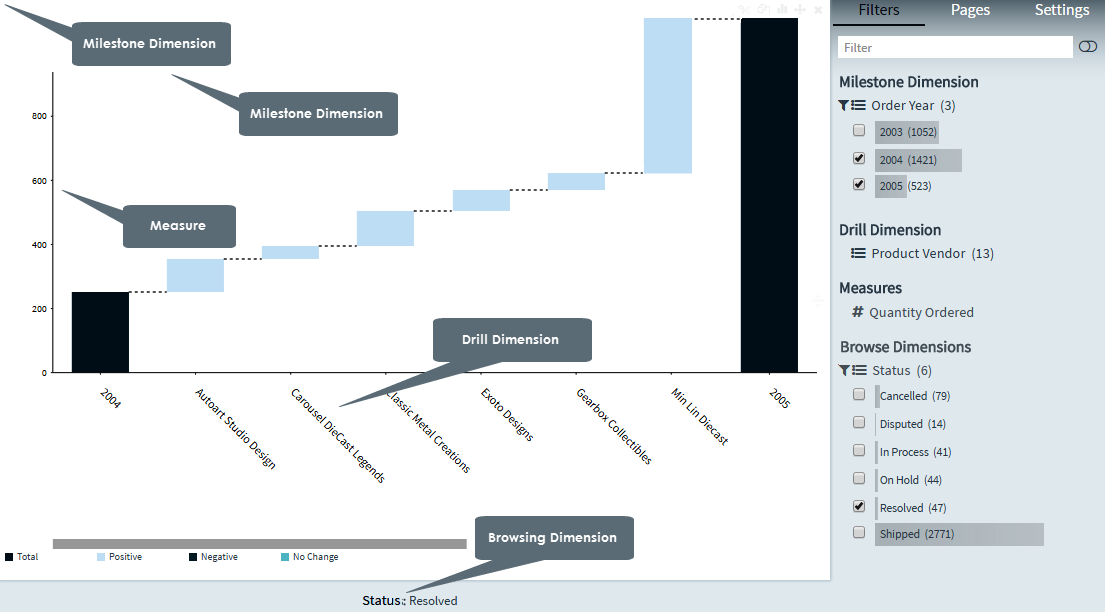
A Waterfall chart is a form of data visualization that helps in understanding the cumulative effect of sequentially introduced positive or negative values. The Waterfall chart is also known as a flying bricks chart or Mario chart due to the apparent suspension of columns (bricks) in mid-air.
A Waterfall chart can be used for analytical purposes, especially for understanding or explaining the gradual transition in the quantitative value of an entity which is subjected to increment or decrement.
Creating waterfall charts
1. On the toolbar, select + New Page from the Pages drop down, or on the Filters and Settings pane, select the Pages tabbed page and then click the + icon to create a new page.
2. Click
the ![]() icon in the chart area
and then select the Advanced tabbed page.
icon in the chart area
and then select the Advanced tabbed page.
3. Select
the Waterfall chart type or click the icon at the top right corner of
the chart area and then select Waterfall
to create a Waterfall chart.
icon at the top right corner of
the chart area and then select Waterfall
to create a Waterfall chart.
4. From the Dimensions pane, specify a waterfallMilestoneDim for the Waterfall chart.
5. Specify a waterfallDrillDim for your chart.
6. Specify a Measure for your chart.
Optionally, specify a Page Dimension for your chart.
7. In the Filters and Settings pane, select any of the following:
▪ Filters tabbed page to browse the chart dimensions using the Dimensions Browser.
▪ Pages to view all pages in the current report as thumbnails.
▪ Settings to define drill through, page, or report properties for the chart.
Defining waterfall chart properties
Envision allows you to define chart properties such as the title, legend, color scheme, data format, X and Y axis settings, and drill through.
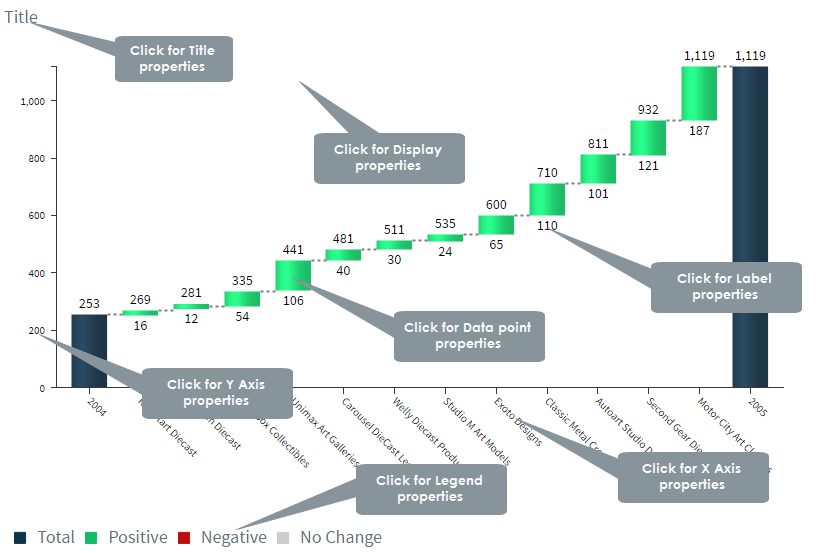
The following table explains how to define these properties.
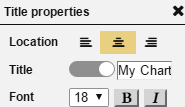
| Title properties | ||
Dialog |
Property | Description |
|
Location | Select a location (left, center, right) for the title. |
| Title | Click the indicator to display or hide the chart title. Specify a new title for your chart. |
|
| Font | Select the font size and style (bold, italic) for the title. | |
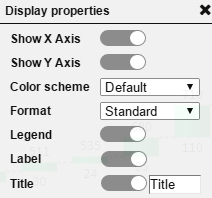
Display properties |
||
|
Show X Axis | Click the indicator to display or hide the X-Axis. |
| Show Y Axis | Click the indicator to display or hide the Y-Axis. | |
| Color Scheme | Select a color scheme from the list of available color schemes. | |
| Format | ||
| Legend | Click the indicator to display or hide the legend. | |
| Label | Click the indicator to display or hide labels for the chart values. | |
| Title | Click the indicator to display
or hide the chart title. Specify a new title for your chart. |
|
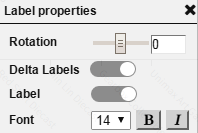
Label properties |
||
|
Rotation | Drag the indicator for rotating the labels for the 'Y' and 'X' positions by 360 degrees, and for moving the labels for the X-Axis and Y-Axis positions vertically and horizontally respectively. |
| Delta Labels | Select a location for the labels (top, bottom) from the list. | |
| Label | Click the indicator to display or hide labels for the chart values. | |
| Font | Select a font size for the labels, and style (bold, italic) from the respective lists. | |
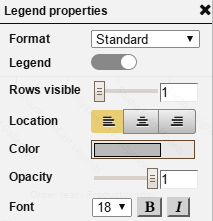
Legend properties |
||
|
Format | Select a data format from the list of existing formats. |
| Legend | Click the indicator to display or hide the legend. | |
| Rows visible | Drag the indicator in the range 1-10 to display the number of visible legend rows. | |
| Location | Specify a location for the legend display (left, center, right). | |
| Color | Select a color for the legend and the line connecting the data points from the color palette, and then click choose. | |
| Opacity | Drag the indicator in the range 0-1 to set the opacity level for the legend. | |
| Font | Select the font size for the legend, and style (bold, italic) from the respective lists. | |
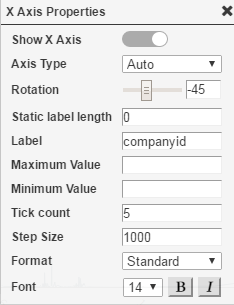
X Axis properties |
||
|
Show X Axis | Click the indicator to display or hide the X-Axis. |
| Rotation | Drag the indicator for rotating the labels for the X-Axis by 360 degrees, and for moving the X-Axis labels vertically and horizontally respectively. | |
| Static label length | Specify the static length for the X-Axis labels (number of alphabets to be displayed). | |
| Label | Enter the text for the X-Axis label. By default, the X-Axis dimension name is set as the default label text. | |
| Font | Select a font size for the X-Axis labels, style (bold, italic) from the respective lists. | |
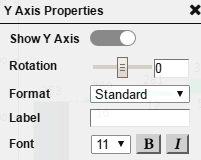
Y Axis properties |
||
|
Show Y Axis | Click the indicator to display or hide the Y-Axis. |
| Rotation | Drag the Rotation indicator for rotating the labels for the Y-Axis by 360 degrees. | |
| Format | Select a data format for displaying the Y-Axis values. | |
| Label | Enter the text for the Y-Axis label. | |
| Font | Select a font size for the Y-Axis labels, style (bold, italic) from the respective lists. | |
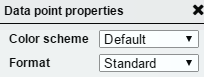
Data point properties |
||
|
Color scheme | Select a color scheme from the list of available color schemes. |
| Format | Select a data format from the list that contains the default data format as well as the data formats that you have created. | |
|
|
Page Properties |
Report Properties |