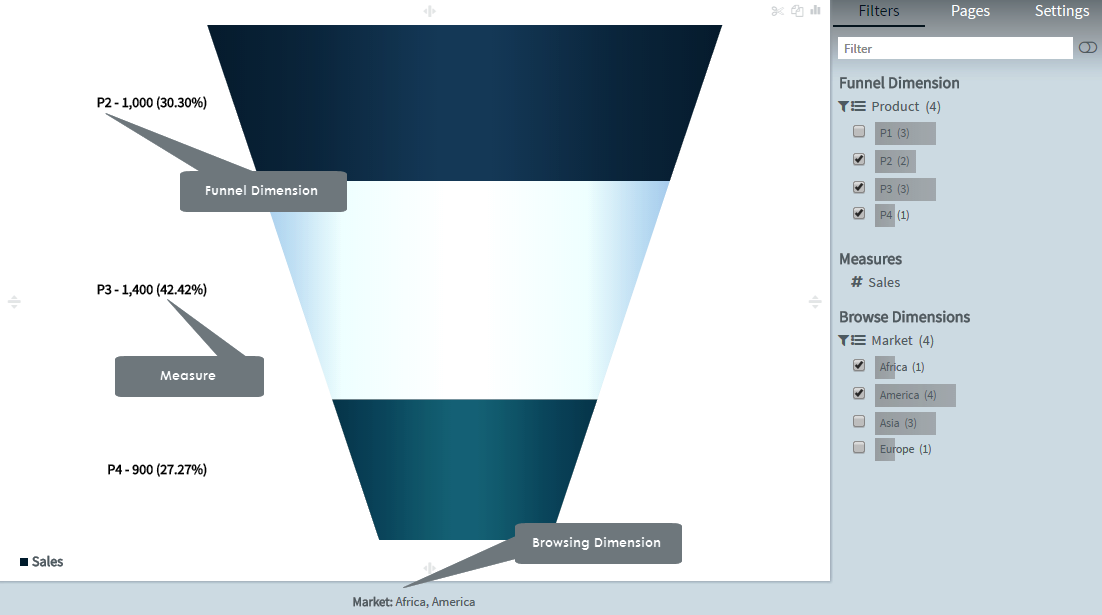
A Funnel chart is a type of chart often used to represent stages in a sales process and show the amount of potential revenue for each stage. This type of chart can also be useful in identifying potential problem areas in an organization’s sales processes. A Funnel chart is similar to a stacked percent Bar Line chart.
A Funnel chart is often used to represent stages in a sales process and show the amount of potential revenue for each stage. This type of chart can also be useful in identifying potential problem areas in an organization's sales processes.
Creating funnel charts
1. On the toolbar, select + New Page from the Pages drop down, or on the Filters and Settings pane, select the Pages tabbed page and then click the + icon to create a new page.
2. Click
the ![]() icon in the chart area
and then select the Advanced tabbed page.
icon in the chart area
and then select the Advanced tabbed page.
3. Select
the Funnel chart type or click the icon at the top right corner of
the chart area and then select Funnel to
create a Funnel chart.
icon at the top right corner of
the chart area and then select Funnel to
create a Funnel chart.
4. From the Dimensions pane, specify a funnelDim for the Funnel chart.
5. Specify a Measure for your chart.
Optionally, specify a Page Dimension for the Funnel chart.
6. In the Filters and Settings pane, select any of the following:
▪ Filters tabbed page to browse the chart dimensions using the Dimensions Browser.
▪ Pages to view all pages in the current report as thumbnails.
▪ Settings to define drill through, page, or report properties for the chart.
Before creating a visualization, it is recommended to select the Dimension Browser view by selecting the Filters tabbed page from the Filters and Settings pane. The Dimensions Browser enables you to easily drag and drop Dimensions or Measures from the Dimensions pane (depending on the chart type) into Dimensions, Measures, Legend, or Browsing Dimensions of the Dimension Browser.
Defining funnel chart properties
Envision allows you to define chart properties such as the color scheme, data format, fonts, labels, legend, title, and drill through.
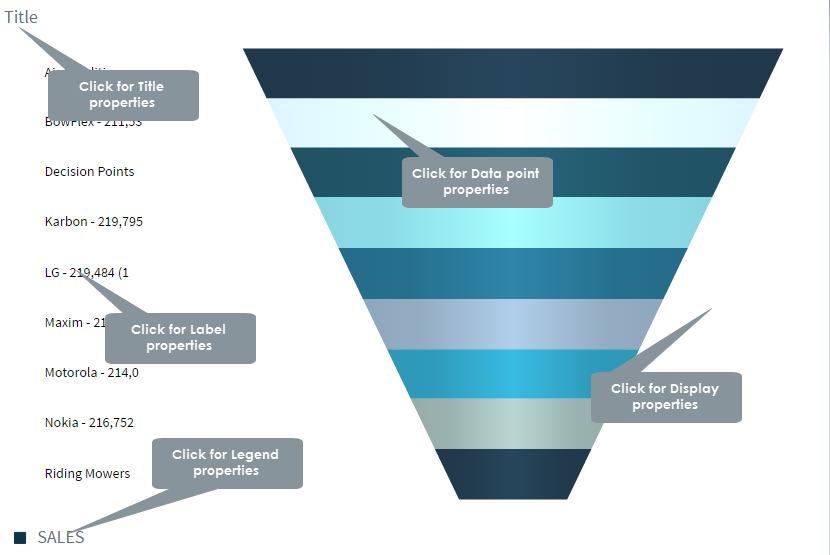
The following table explains how to define these properties.
| Title properties | ||
Dialog |
Property | Description |
|
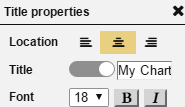
Location | Select a location (left, center, right) for the title. |
| Title | Click the indicator to display or hide the chart title. Specify a new title for your chart. |
|
| Font | Select a font size and style (bold, italic) for the title. | |
Display properties |
||
|
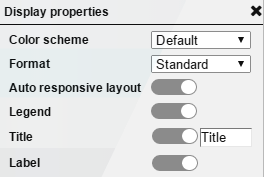
Color Scheme | Select a color scheme from the list of available color schemes. |
| Format | Select a data format from the list that contains the default data format as well as the data formats that you have created. | |
| Auto responsive layout | Click the indicator to enable auto responsive layout for various devices. | |
| Legend | Click the indicator to display or hide the legend. | |
| Title | Click the indicator to display or hide the chart title. Specify a new title for your chart. |
|
| Label | Click the indicator to display or hide labels for the chart values. | |
Label properties |
||
|
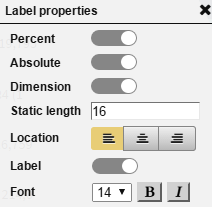
Percent | Click the indicator to display or hide the percentage contribution of each dimensional element in the funnel. |
| Absolute | Click the indicator to display or hide the absolute contribution of each dimensional element in the funnel. | |
| Dimension | Click the indicator to display or hide the funnel dimensional elements. | |
| Static length | Specify the static length for the labels (number of alphabets to be displayed). | |
| Location | Select a location for the labels (top, bottom) from the list. | |
| Label | Click the indicator to display or hide labels for the chart values. | |
| Font | Select a font size and style (bold, italic) for the labels. | |
Legend properties |
||
|
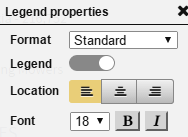
Format | Select a data format from the list of existing formats. |
| Legend | Click the indicator to display or hide the legend. | |
| Location | Specify a location for the legend display (left, center, right). | |
| Font | Select a font size and style (bold, italic) for the legend. | |
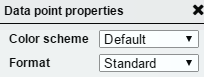
Data point properties |
||
|
Color scheme | Select a color scheme from the list of available color schemes. |
| Format | Select a data format from the list of existing formats. | |
|
|
Page Properties |
Report Properties |