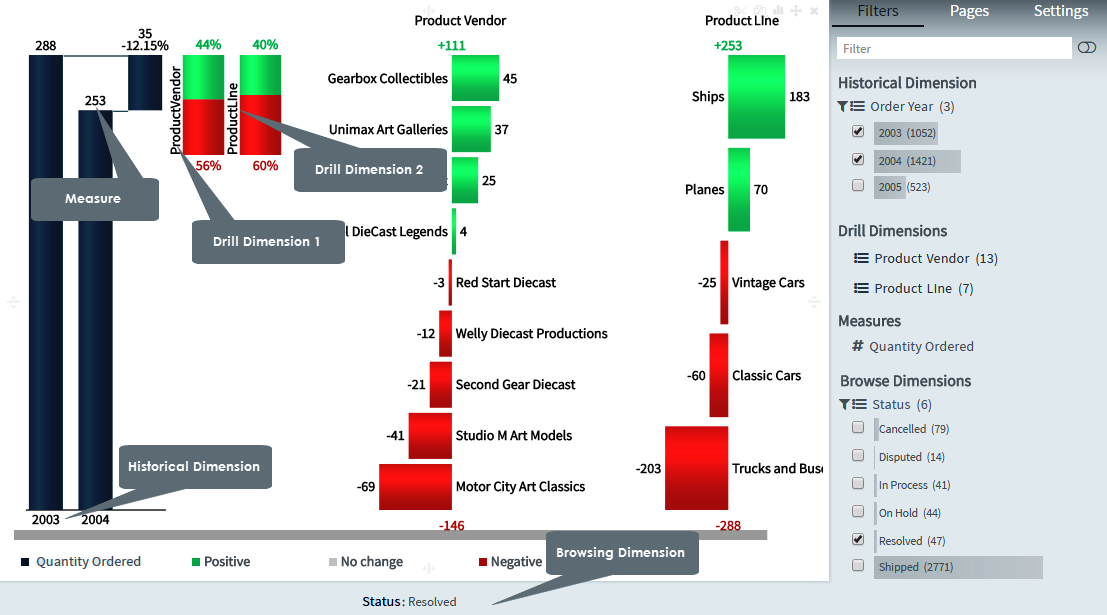
You use the Delta Drill chart to drill through a delta by assigning an order to each of the elements that determine the delta. When you select a dimension, two items to be compared are extracted. Delta Drill charts can have more than one drill dimension.
In addition, you can also use another Delta Drill environment to view the absolute values of each of the items.
Delta Drill charts are particularly useful in scenarios where you want to view the delta across two dimensions - Budget Vs Actual, for example, and the composition contributing to the delta.
Creating delta drill charts
1. On the toolbar, select + New Page from the Pages drop down, or on the Filters and Settings pane, select the Pages tabbed page and then click the + icon to create a new page.
2. Click
the ![]() icon in the chart area
and then select the Advanced tabbed page.
icon in the chart area
and then select the Advanced tabbed page.
3. Select
the Delta Drill chart type or click the icon at the top right corner of
the chart area and then select Delta Drill
to create a Delta Drill chart.
icon at the top right corner of
the chart area and then select Delta Drill
to create a Delta Drill chart.
4. From the Dimensions pane, specify a Historical Dimension for the Delta Drill chart.
5. Specify a Drill Dimension for your chart.
6. Specify a Measure for your chart.
7. In the Filters and Settings pane, select any of the following:
▪ Filters tabbed page to browse the chart dimensions using the Dimensions Browser.
▪ Pages to view all pages in the current report as thumbnails.
▪ Settings to define drill through, page, or report properties for the chart.
Defining delta drill chart properties
Envision allows you to define chart properties such as the color scheme, data, data format, delta group, drill preview, drill fonts, legend, title, and drill through.
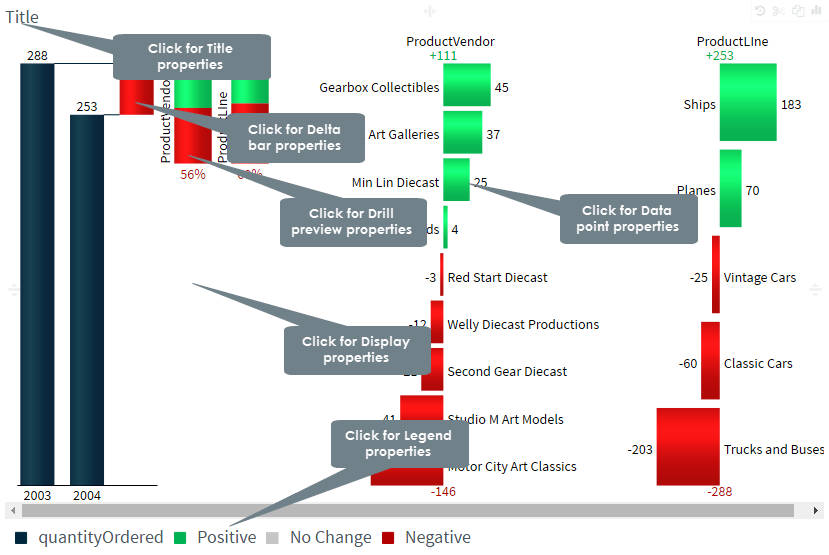
The following table explains how to define these properties.
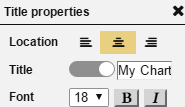
| Title properties | ||
Dialog |
Property | Description |
|
Location | Select a location (left, center, right) for the title. |
| Title | Click the indicator to display or hide the chart title. Specify a new title for your chart. |
|
| Font | Select a font size and style (bold, italic) for the title. | |
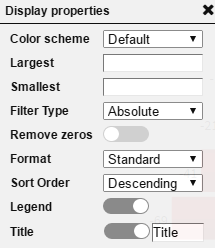
Display properties |
||
|
Color Scheme | Select a color scheme from the list of available color schemes. |
| Largest | Specify the threshold values for the filter for displaying two successive highest values. | |
| Smallest | Specify the threshold values for the filter for displaying two successive lowest values. | |
| Filter Type | Select a filter type (absolute, percentage) for displaying the delta as absolute or percentage values. | |
| Remove zeros | Select the Remove 0s check box to hide the zero values from the delta. | |
| Format | Select a data format from the list that contains the default data format as well as the data formats that you have created. | |
| Sort Order | Select a sort order (ascending, descending) for sorting the elements of the drill dimension. | |
| Legend | Click the indicator to display or hide the legend. | |
| Title | Click the indicator to display or hide the chart title. Specify a new title for your chart. |
|
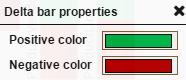
Delta bar properties |
||
|
Positive Color | Select a color for the positive values in the delta bar from the color palette, and then click choose. |
| Negative Color | Select a color for the negative values in the delta bar from the color palette, and then click choose. | |
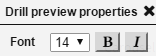
Drill preview properties |
||
|
Font | Select a font size and style (bold, italic) for the drill preview. |
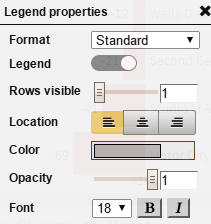
Legend properties |
||
|
Format | Select a data format from the list that contains the default data format as well as the data formats that you have created. |
| Legend | Click the indicator to display or hide the legend. | |
| Rows visible | Drag the indicator in the range 1-10 to display the number of visible legend rows. | |
| Location | Specify a location for the legend display (left, center, right). | |
| Color | Select a color for the legend and the line connecting the data points from the color palette, and then click choose. | |
| Opacity | Drag the indicator in the range 0-1 to set the opacity level for the legend. | |
| Font | Select the font size and style (bold, italic) for the legend. | |
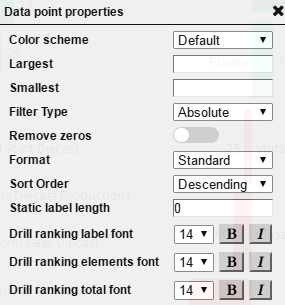
Data point properties |
||
|
Color scheme | Select a color scheme from the list of available color schemes. |
| Largest | Specify the threshold values for the filter for displaying two successive highest values. | |
| Smallest | Specify the threshold values for the filter for displaying two successive lowest values. | |
| Filter Type | Select a filter type (absolute, percentage) for displaying the delta as absolute or percentage values. | |
| Remove zeros | Select the Remove 0s check box to hide the zero values from the delta. | |
| Format | Select a data format from the list that contains the default data format as well as the data formats that you have created. | |
| Sort Order | Select a sort order (ascending, descending) for sorting the elements of the drill dimension. | |
| Static label length | Specify the static length for the labels (number of alphabets to be displayed). | |
| Drill ranking label font | Select a font size and style (bold, italic) for the drill ranking labels. | |
| Drill ranking elements font | Select a font size and style (bold, italic) for the drill ranking elements. | |
| Drill ranking total font | Select a font size and style (bold, italic) for the drill ranking totals. | |
|
|
Page Properties |
Report Properties |